The Unshakeable Foundation of Salty Snacks
PepsiCo's strategic brilliance lies not in its iconic beverage rivalry but in its undisputed dominion over the global snack aisle. The Frito-Lay North America (FLNA) division remains the company's crown jewel, a fortress of profitability built on a foundation of perennial brand loyalty and an unparalleled distribution network that consistently delivers growth.
Deconstructing the Revenue Engine
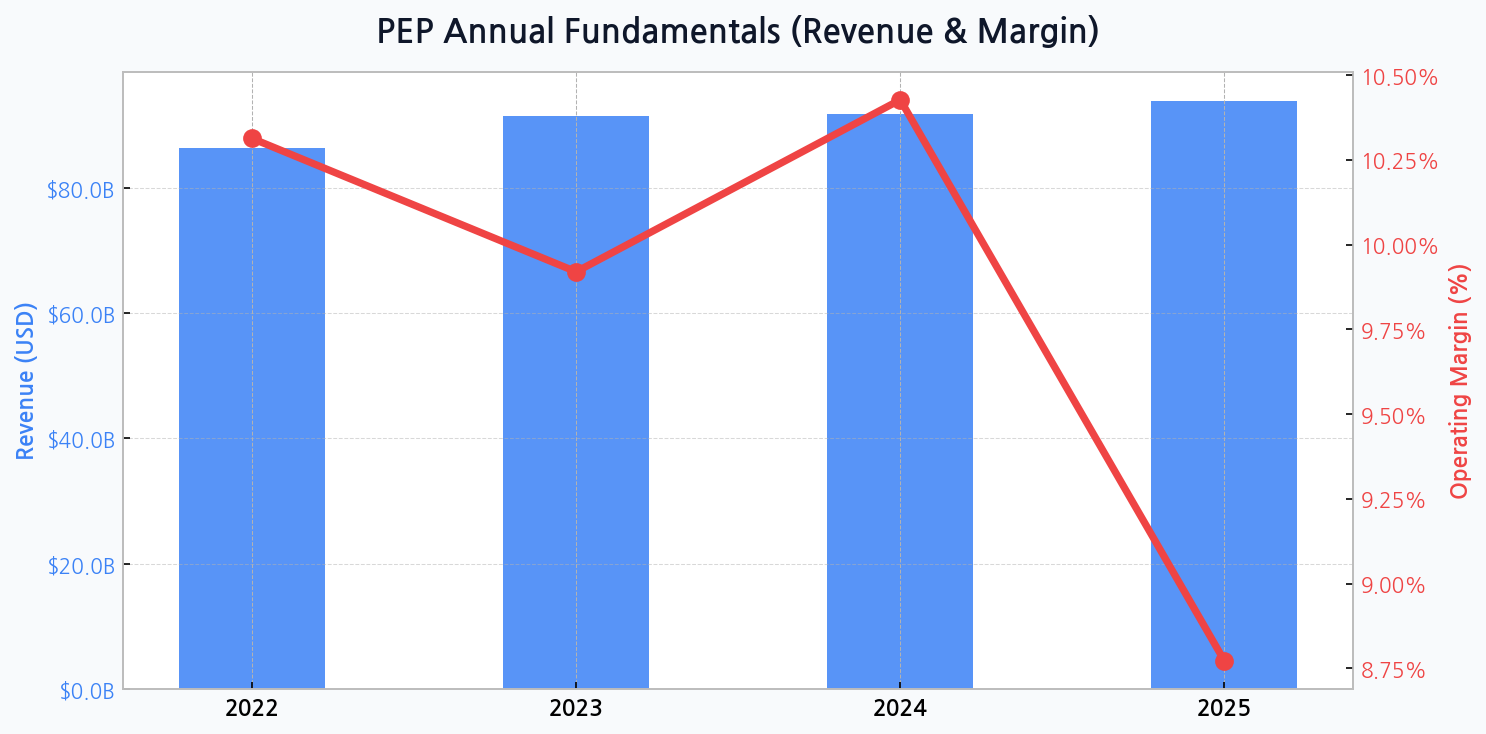
While revenue growth appears robust, climbing from $86.4B in 2022 to a projected $93.9B in 2025, a closer look reveals a dependency on key segments. The snack portfolio consistently outperforms beverages, providing a crucial buffer against shifting consumer tastes and the fierce competition in the drinks market.
| Business Segment | Estimated Revenue Share | Growth Trajectory | Competitive Moat |
|---|---|---|---|
| Frito-Lay North America | ~ 30% | Stable & Expanding | High (Distribution & Brand) |
| PepsiCo Beverages N.A. | ~ 30% | Moderate & Competitive | Medium (Brand & Scale) |
| Quaker Foods N.A. | ~ 4% | Slow & Mature | Medium (Brand Recognition) |
| International Divisions | ~ 36% | Variable & High-Potential | Medium-High (Regional Strength) |
DIFF Insight: The table highlights that nearly one-third of PepsiCo's strength comes from a single, high-margin domestic division. This concentration is both a source of stability and a potential vulnerability. Any disruption to FLNA's supply chain or a significant shift in North American consumer habits could disproportionately impact the entire enterprise's financial health.
Profitability Under a Magnifying Glass
The core tension in PepsiCo's narrative is the divergence between its top-line growth and bottom-line efficiency. Despite revenue climbing to $91.5B in 2023, the operating margin dipped to 9.9% from 10.3% the prior year. The forecast for 2025 is even more alarming, with margins projected to compress sharply to 8.8%, signaling that inflationary headwinds are eroding profitability faster than price increases can offset them.
[Chart] Total Assets (Bar) & Debt Ratio (Line) for PEP
Wall Street's Cautious Optimism
"PepsiCo's ability to drive revenue is not in question. The strategic challenge is managing a global cost structure in an era of volatility. Every basis point of margin erosion represents hundreds of millions in lost profit, a reality that the market is beginning to price in more aggressively."
The Balance Sheet's Quiet Burden
Underpinning this operational story is a balance sheet characterized by significant leverage. Total assets are expected to expand to $107.4B by 2025, but this growth is financed with substantial debt. The debt ratio has remained stubbornly high, hovering above 81% from 2022 to 2024, indicating a reliance on borrowing to fund operations and shareholder returns. This constrains flexibility for major acquisitions or weathering a prolonged economic downturn.
Gauging Market Sentiment Against Peers
| Metric | PepsiCo (PEP) | Coca-Cola (KO) | Industry Average |
|---|---|---|---|
| P/E Ratio (TTM) | ~ 23x | ~ 24x | ~ 21x |
| P/S Ratio (TTM) | ~ 2.5x | ~ 5.8x | ~ 2.2x |
| Dividend Yield | ~ 3.2% | ~ 3.1% | ~ 2.8% |
DIFF Insight: PepsiCo trades at a premium to the industry average but at a significant discount to its primary beverage rival, Coca-Cola, on a price-to-sales basis. This reflects the market's appreciation for KO's higher-margin, asset-light model compared to PEP's capital-intensive manufacturing and distribution network. The valuation suggests investors reward profitability and lean operations more than sheer revenue scale.
Strategic Imperatives for the Next Era
The path forward requires a delicate balancing act. While revenue expansion is a positive signal, the company's long-term value will be dictated by its ability to restore margin health. This involves more than just price adjustments; it demands a fundamental re-evaluation of its supply chain, operational efficiency, and portfolio management. The challenge is to innovate without cannibalizing the core cash cows that fund the enterprise.
- Cost Structure Overhaul: Aggressively pursue automation and supply chain optimization to combat input cost inflation.
- International Growth Focus: Leverage the Frito-Lay playbook to accelerate market share gains in emerging economies where snack penetration is lower.
- Healthy Snacking Pivot: Increase investment in 'better-for-you' brands to capture health-conscious consumer segments.
- Debt Management: Prioritize deleveraging the balance sheet to increase financial resilience and strategic agility.
The Specter of Latent Risks
Beyond direct financial metrics, PepsiCo faces a matrix of external threats. Changes in consumer behavior towards healthier options and regulatory pressures on sugary drinks and high-sodium snacks pose a significant long-term risk. The company's future hinges on its ability to pivot its massive portfolio faster than public sentiment and government policy can shift, a true test of strategic capital allocation.
| Risk Factor | Probability | Potential Impact | Mitigation Strategy |
|---|---|---|---|
| Sustained Margin Erosion | High | High | Cost-cutting, Price Optimization |
| Regulatory Headwinds | Medium | High | Portfolio Diversification (Health) |
| Intensified Competition | High | Medium | Marketing, Innovation (R&D) |
| Supply Chain Disruption | Medium | High | Geographic Diversification of Sourcing |
DIFF Insight: The highest probability risk is directly tied to the financial data: margin compression. While regulatory threats have a high potential impact, they are slower-moving. The immediate battle for PepsiCo is internal—a fight against rising costs that directly threatens its ability to translate its massive revenue into shareholder value.