Quantitative Snapshot: The Current State of Play
| Indicator | Value | Status | Implication |
|---|---|---|---|
| Current Price | $370.87 | -0.59% | Negative short-term momentum |
| RSI (14) | 38.37 | Neutral | Approaching oversold, but room to fall |
| ADX (14) | 28.87 | Strong Trend | The current downtrend has significant force |
| MA50 Gap | -5.78% | Bearish | Significant deviation below mid-term average |
| 20D Change | -7.71% | Bearish | Accelerating downward price action |
The Widening Chasm: Price Capitulates Below Key Averages
The current price of $370.87 reveals a technically damaged structure. The stock is trading firmly below all key moving averages: the MA20 at $377.13, the MA50 at $393.62, and the MA100 at $435.83. This divergence, particularly the -5.78% gap from the MA50, signals that sellers are in complete control. The failure to hold these levels confirms a shift from a bullish to a bearish regime, where former support levels now act as formidable resistance. This setup often precedes further downside until a clear capitulation event occurs.
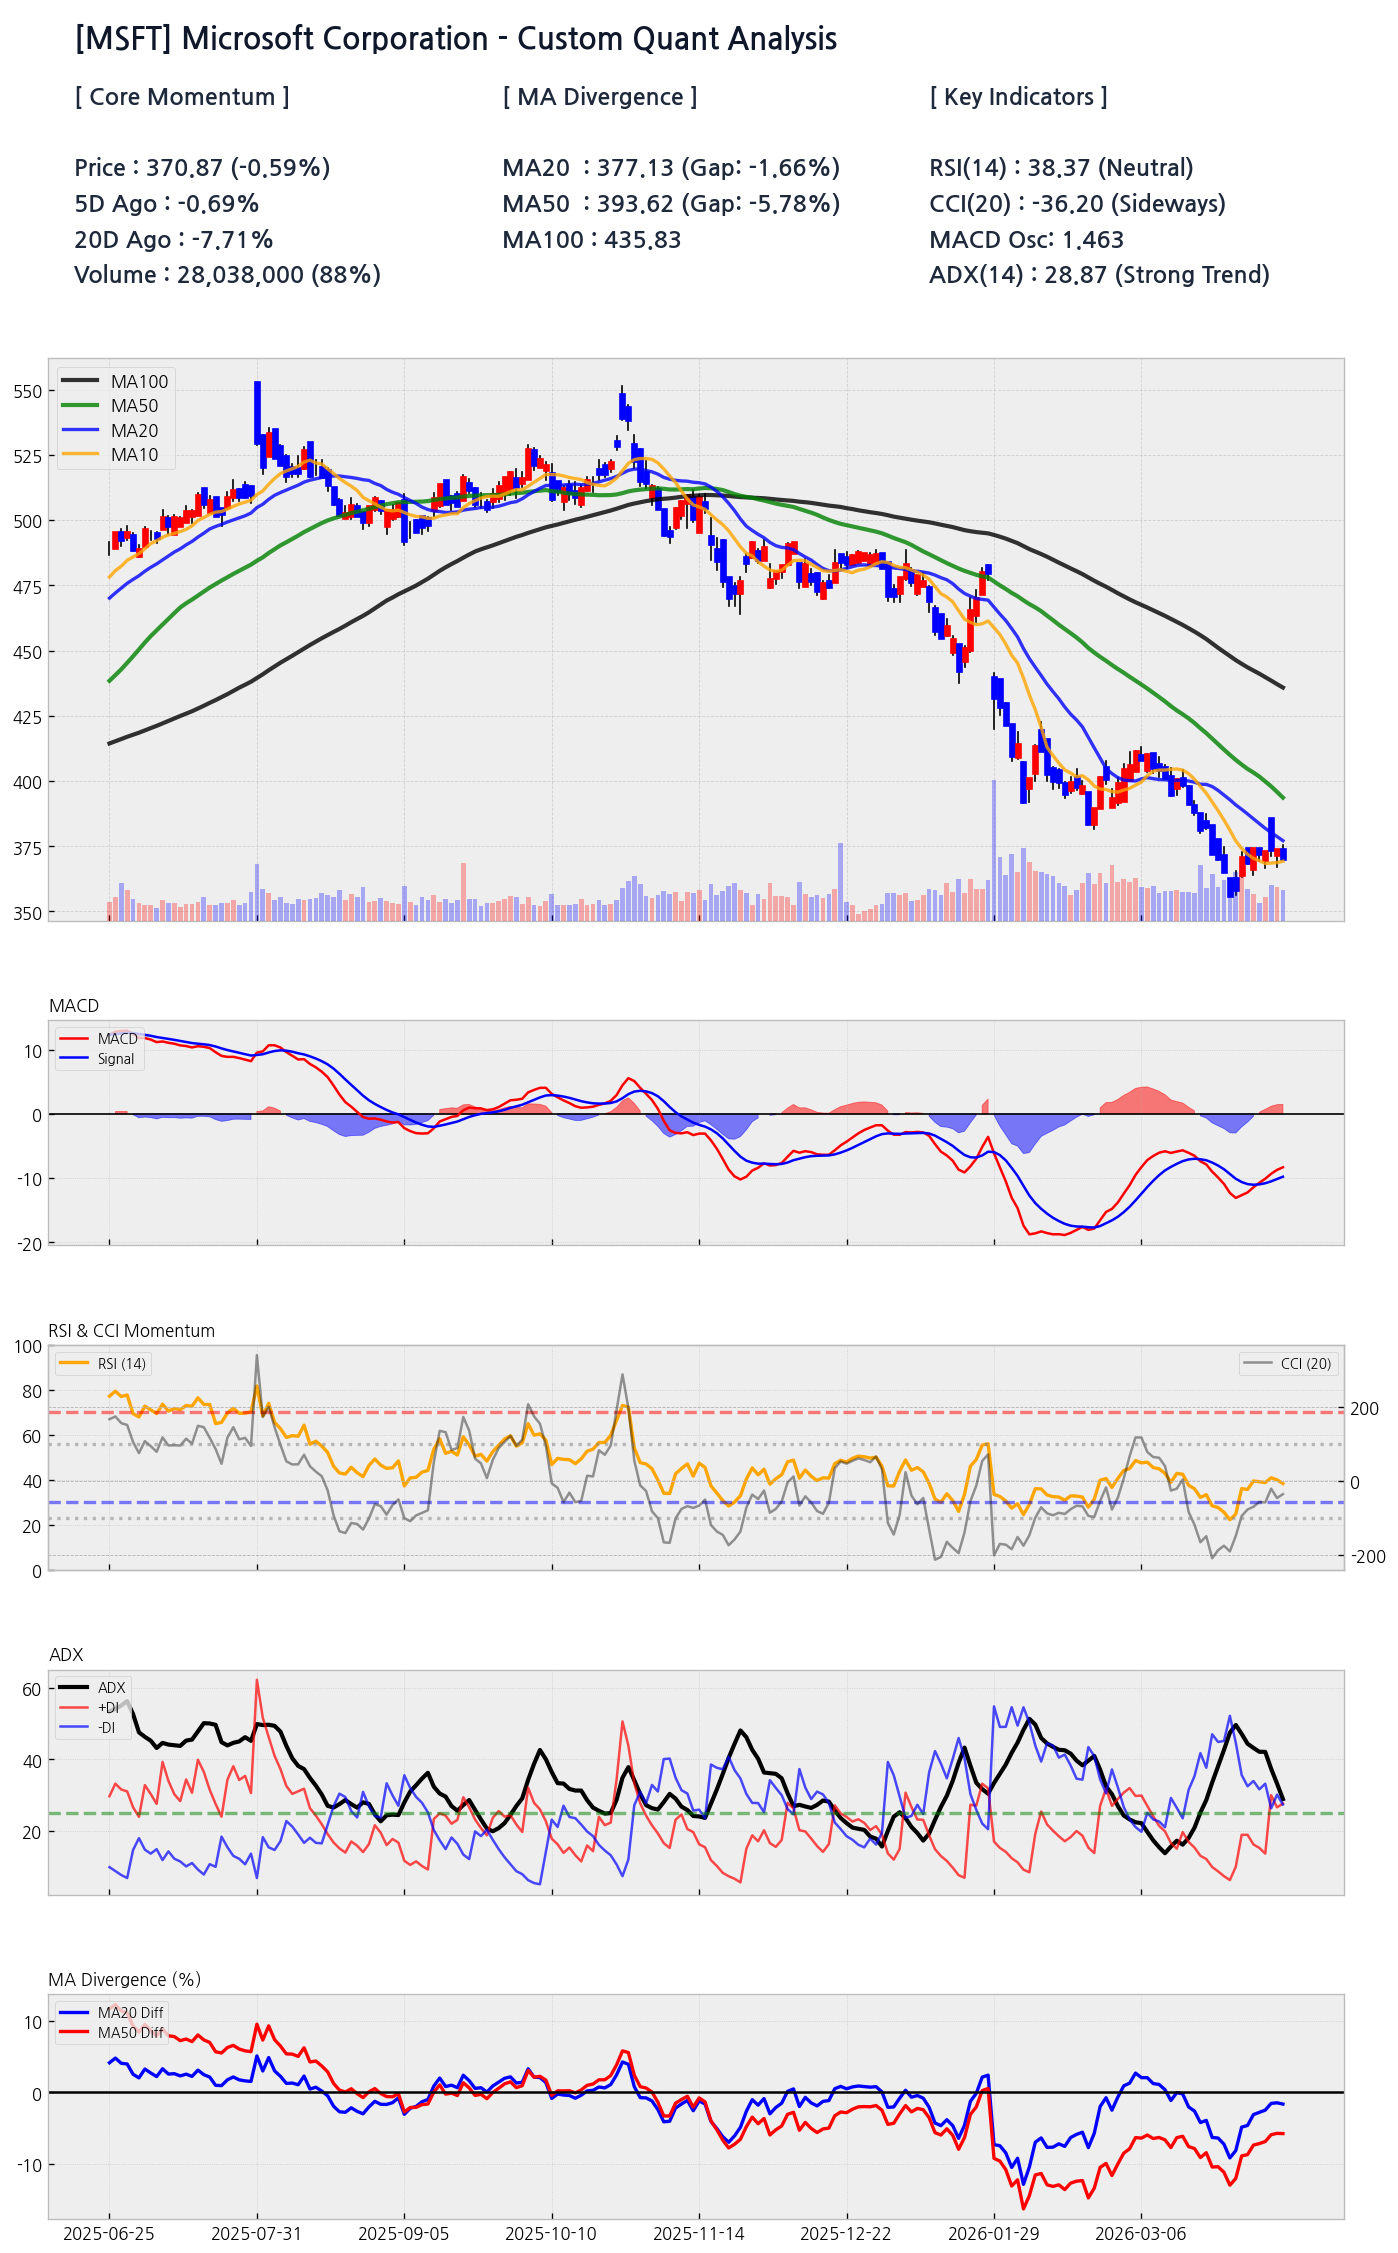
[Chart] Data-driven visualization of MSFT's recent price trend and support/resistance lines
[Chart] MSFT daily price action showing a clear breakdown below the 20, 50, and 100-day moving averages, with the strong support level at $356.28 now in focus.
ADX Confirms the Downtrend's Vigor
An ADX reading of 28.87 is a critical piece of evidence that cannot be ignored. While many indicators point to direction, the ADX measures the strength of the trend itself. A value above 25, as we see here, indicates that the current downtrend is not just market noise but a sustained, powerful move. This high reading gives credence to the bearish scenario, suggesting that attempts to find a bottom may be premature. The validated downward velocity warns that the path of least resistance remains to the downside.
On the Precipice: Testing the Last Line of Defense
"The market is now focused squarely on the $356.28 support level. A breach of this floor would invalidate any near-term bullish thesis and could open a new chapter of price discovery to the downside. This is the line in the sand for both bulls and bears."
Mapping Future Trajectories: A Probabilistic Gauntlet
| Scenario | Probability | Price Target | Key Drivers |
|---|---|---|---|
| Bear Case | 55% | $340 - $356 | Breach of $356.28 support; continued macro headwinds. |
| Base Case | 35% | $357 - $380 | Successful defense of support, followed by consolidation. |
| Bull Case | 10% | $395+ | Strong catalyst-driven reclaim of the MA50 ($393.62). |
Dissecting Momentum Indicators
The Relative Strength Index (RSI) at 38.37 is hovering just above oversold territory (30). While this could suggest a potential for a short-term bounce, it is not a compelling buy signal in the context of a strong ADX. In powerful downtrends, RSI can remain in a low range for extended periods. Furthermore, the MACD Oscillator's low value of 1.463, while positive, is weak and shows little upward conviction, reinforcing the idea that any strength is likely to be fleeting. We are watching for capitulation volume spikes on a final move down as a potential signal of a bottom.
Strategic Imperatives in a Bearish Climate
- The primary trend is down. Fighting this trend is a low-probability strategy.
- The key battleground is the strong support level at $356.28. Its defense or failure will dictate the next major move.
- Resistance is clearly defined at the MA20 ($377.13) and MA50 ($393.62). Rallies to these levels are likely to attract sellers.
- The strong ADX reading suggests traders should be cautious of premature bottom-fishing.
MA Divergence as a Leading Indicator of Weakness
The MA Divergence subplot quantifies the bearish thesis. The negative values for both the MA20 and MA50 differences indicate that short-term and mid-term momentum are both deteriorating. This synchronized weakness across multiple timeframes is a powerful confirmation of the prevailing downtrend. The structural price decay shown by these metrics suggests that a durable bottoming process, rather than a sharp V-shaped recovery, is the more likely outcome.
Valuation vs. Technicals: A Deepening Conflict
| Indicator | Reading | Interpretation |
|---|---|---|
| RSI(14) | 38.37 | Weak, approaching oversold |
| CCI(20) | -36.20 | Sideways to bearish momentum |
| MACD Osc | 1.463 | Slightly positive but weak crossover |
| ADX(14) | 28.87 | Strong and established trend in place |