Quant Desk Initial Diagnosis
The current technical posture for Alphabet Inc. is one of pronounced conflict. The price action at $295.77 reflects a short-term bounce (+5.29% over 5 days) that is now colliding with significant overhead resistance from key moving averages. This creates a precarious balance point where indicators are giving mixed signals, demanding a disciplined, scenario-based approach rather than a high-conviction directional bet.
| Indicator | Value | Status | Implication |
|---|---|---|---|
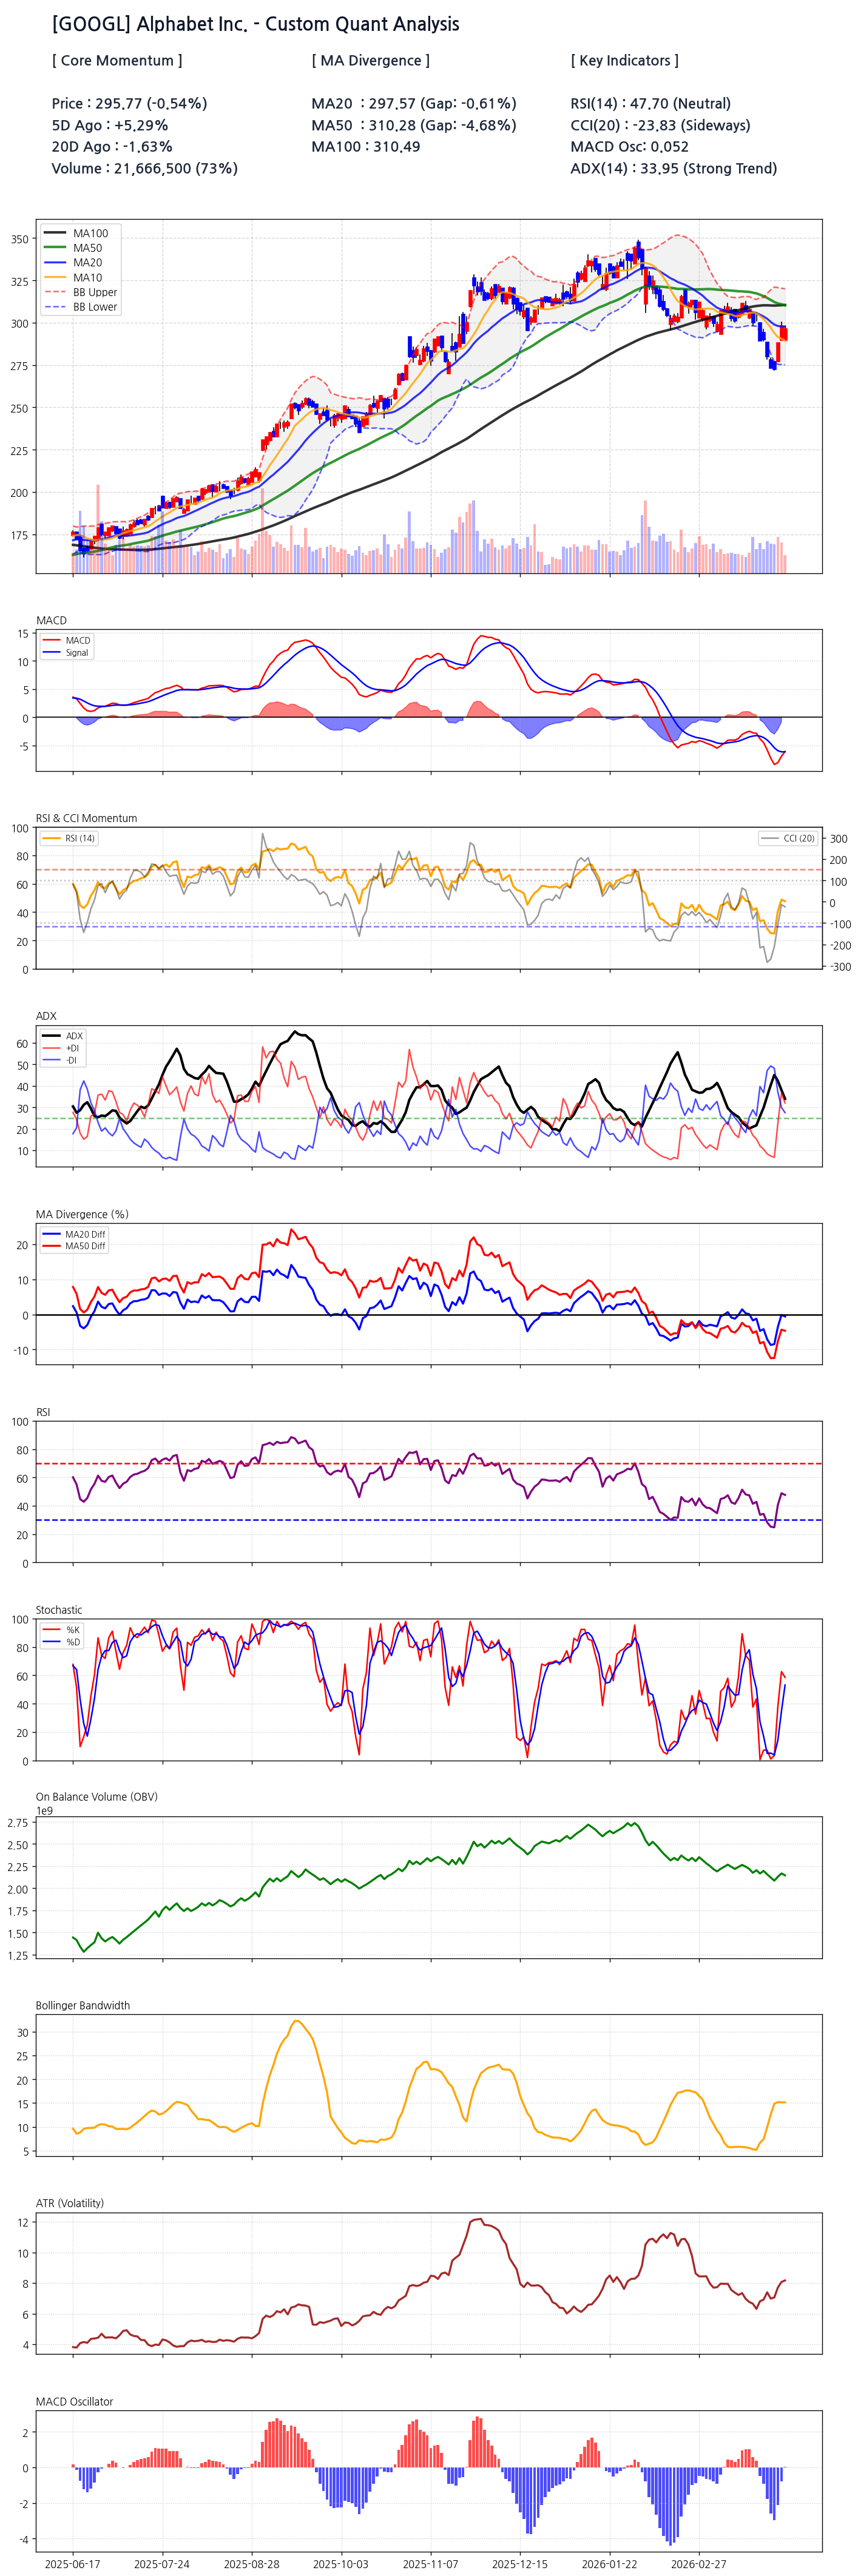
| Price | $295.77 | -0.54% | Consolidating after a recent drop. |
| MA20 Divergence | -0.61% | Bearish | Immediate resistance overhead. |
| MA50 Divergence | -4.68% | Strongly Bearish | Significant medium-term weakness. |
| RSI (14) | 47.70 | Neutral | No immediate overbought/oversold pressure. |
| ADX (14) | 33.95 | Strong Trend | The preceding downtrend has significant force. |
The Price Is Submerged Below Key Averages
Price is currently trapped below its 20-day ($297.57), 50-day ($310.28), and 100-day ($310.49) moving averages. This configuration is classically bearish, with each MA level now acting as a layer of resistance. The most critical battle is at the MA20; a failure to decisively break above this level would confirm that sellers remain in control. The significant price-MA divergence, especially with the MA50 at -4.68%, suggests that any rally will likely be met with formidable selling pressure.
[Chart] Data-driven visualization of GOOGL's recent price trend and support/resistance lines
[Chart] GOOGL price action relative to key moving averages and established support/resistance zones, highlighting the current consolidation phase below the MA20.
A Deceptive Calm in Momentum Indicators
- RSI (14) at 47.70: The Relative Strength Index is in neutral territory. This lack of directional bias indicates market indecision and a temporary equilibrium between buyers and sellers. It is neither a buy nor a sell signal on its own but warns that energy is building for the next directional move.
- CCI (20) at -23.83: Similar to the RSI, the Commodity Channel Index is in its neutral 'zero-bound' range, indicating a sideways market condition and a lack of strong momentum.
- MACD Oscillator at 0.052: The MACD has posted a marginal bullish crossover. However, its proximity to the zero line renders the signal extremely weak and susceptible to a swift reversal, suggesting it's more of a pause in downside momentum than the start of a new uptrend.
ADX Unmasks the Underlying Trend Strength
While momentum oscillators whisper neutrality, the ADX at 33.95 screams that a strong trend is in force. Given the recent price trajectory, this confirms the power of the preceding downtrend. This is a critical piece of evidence; it suggests that the current consolidation is likely a pause or 'bear flag' pattern rather than a genuine bottoming process. The market is resting, not reversing.
Probabilistic Future Scenarios
| Scenario | Probability | Price Target | Key Catalyst / Trigger |
|---|---|---|---|
| Base Case (Consolidation) | 55% | $270 - $280 | Consistent rejection from the MA20 ($297.57). |
| Bull Case (Reversal) | 25% | $310 - $315 | Sustained close above the MA20 with increasing volume. |
| Bear Case (Breakdown) | 20% | $240 - $250 | A decisive break of the recent swing lows around $273. |
Volume Profile Reveals Lack of Conviction
The current volume of 21.6 million shares is at 73% of its average, which is notably subdued. This low participation during the recent price stabilization suggests a lack of institutional conviction. Neither bulls nor bears are committing significant capital at this juncture. A breakout in either direction would need to be accompanied by a surge in volume to be considered valid. The rising On Balance Volume (OBV) trend seen in the charts, however, points to long-term accumulation, creating a bullish divergence against the recent price weakness.
Defining the Battlefield: Hard Support and Resistance
- Immediate Resistance: The MA20 at $297.57 is the first line of defense for bears. A failure to clear this is a key bearish signal.
- Major Resistance Zone: The confluence of the MA50 and MA100 around $310 forms a formidable ceiling.
- Immediate Support: Recent swing lows around the $273-$275 area provide initial support.
- Strong Support (Low): The 120-day key support level is firmly established at $235.52, representing a maximum pain point for bulls if the current structure breaks down.
A Brief Look at Volatility
The Bollinger Bandwidth indicator shows a contraction, which often precedes a period of expanding volatility. Combined with the low volume and neutral momentum, the market is coiling. The Average True Range (ATR) has been climbing, indicating that while the directional trend is sideways, daily price swings are getting larger. This environment of rising volatility and indecisive direction signals that a significant, trend-defining move is becoming increasingly probable. This setup often punishes traders who lack a clear stop-loss strategy, as the eventual breakout can be violent.