Quant Signal Dashboard: AMZN at a Crossroads
| Metric | Value | Indication | Commentary |
|---|---|---|---|
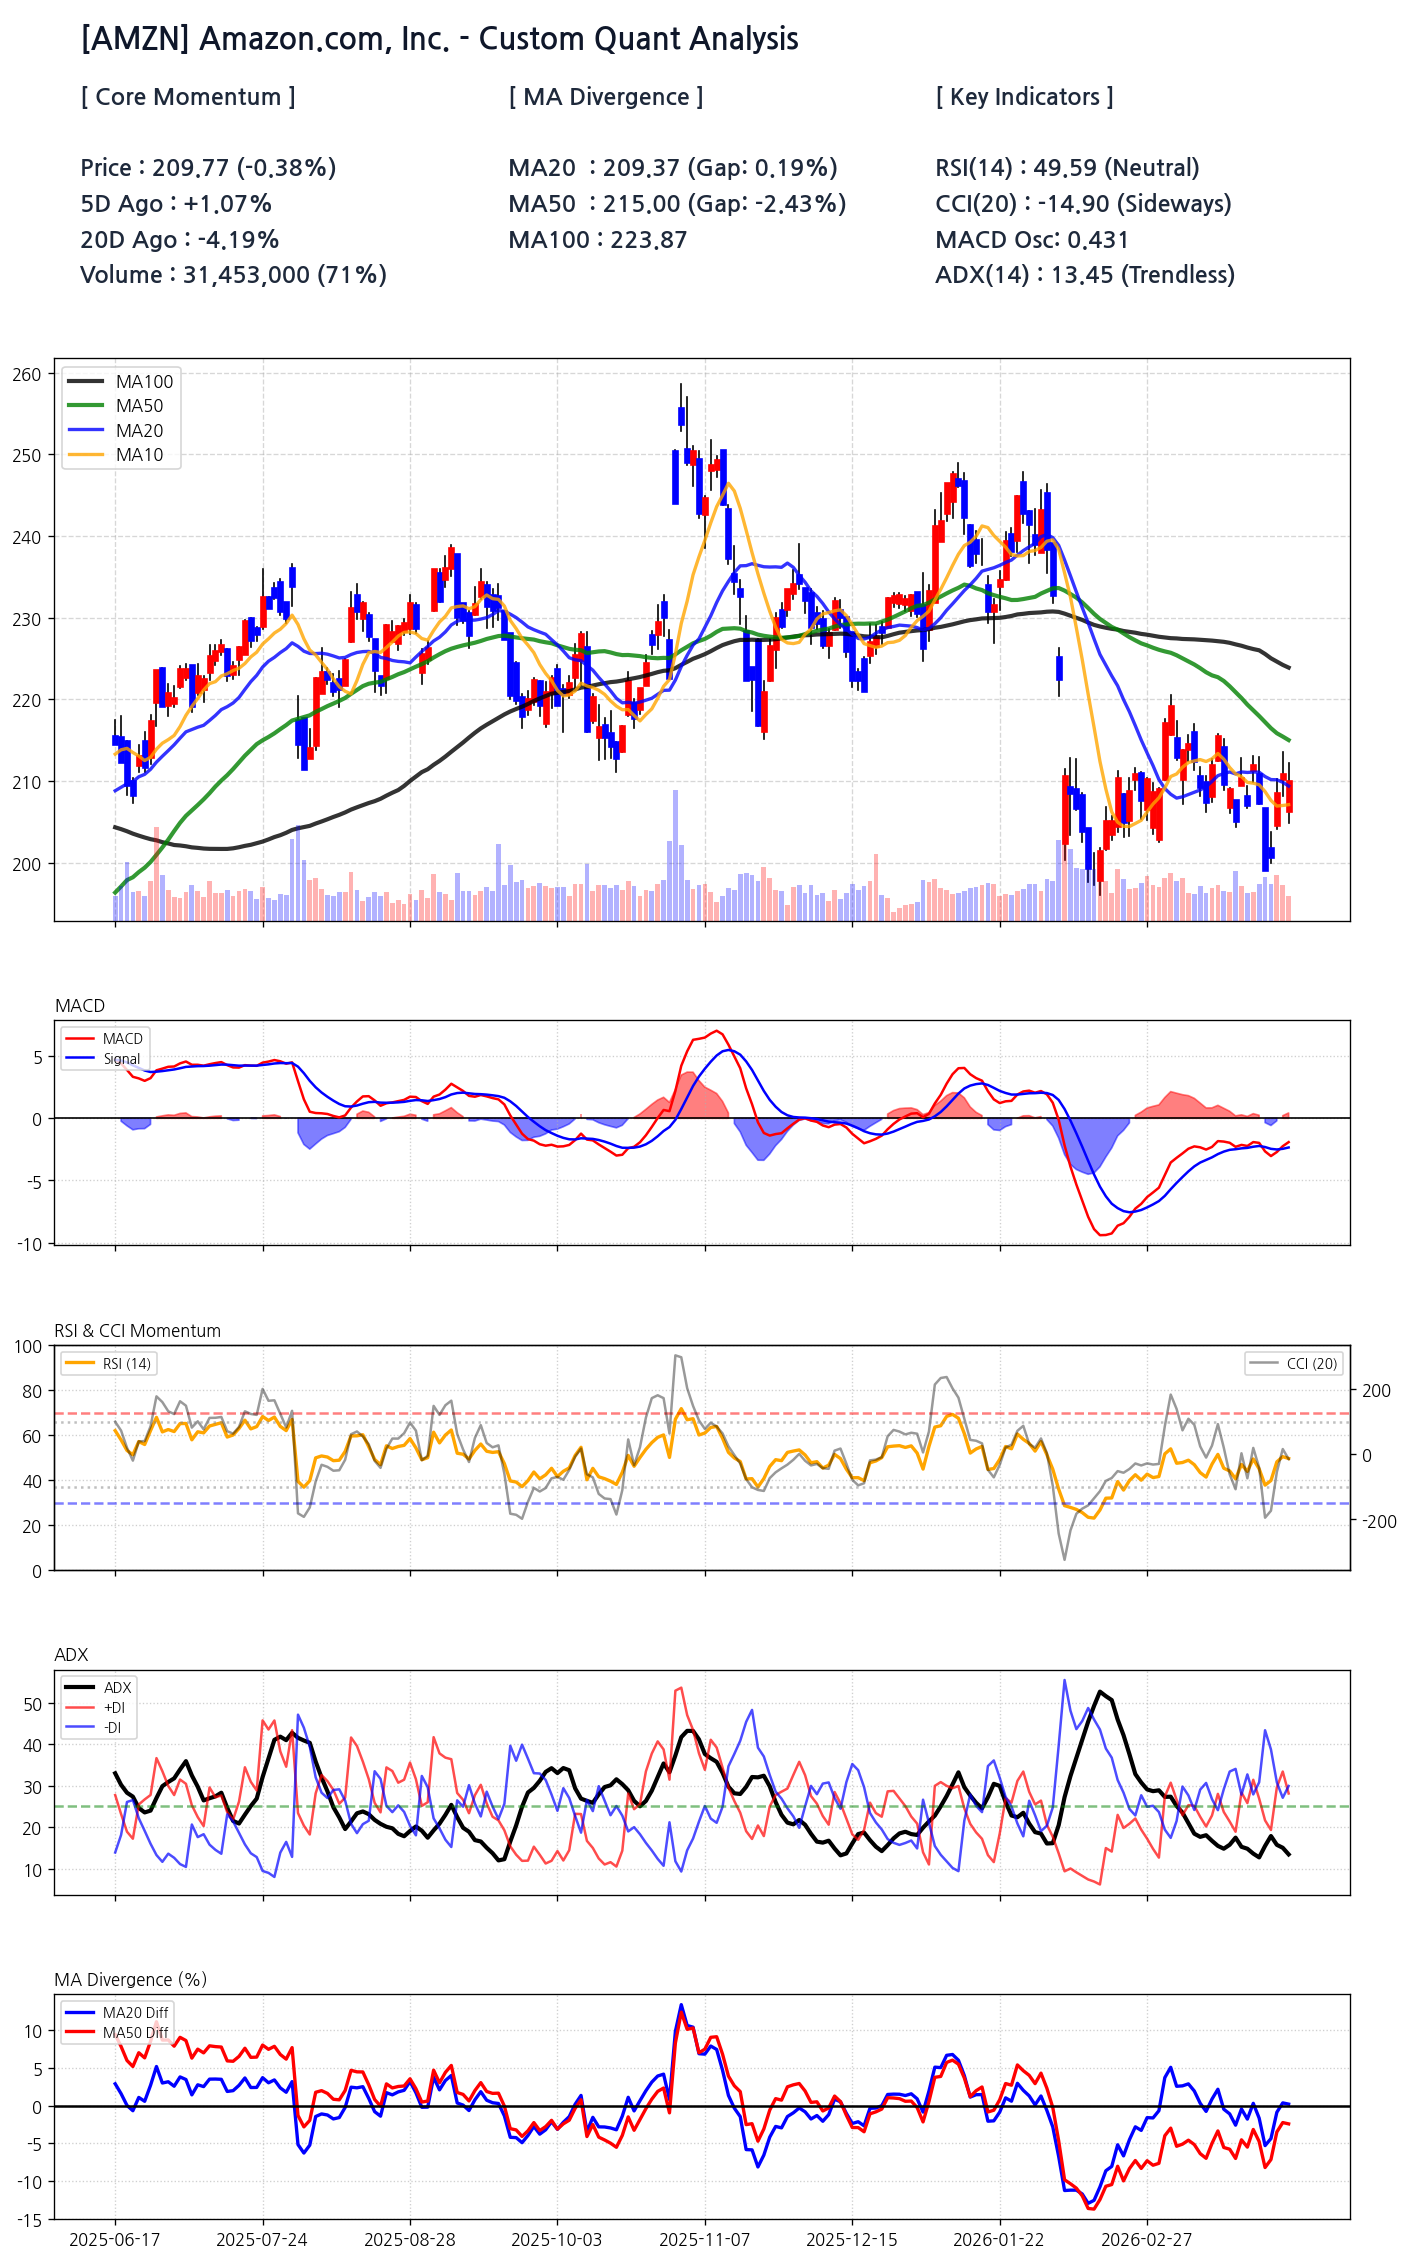
| Price | $209.77 | Neutral | Trapped below key medium-term moving averages. |
| RSI (14) | 49.59 | Neutral | No overbought or oversold pressure; market in equilibrium. |
| ADX (14) | 13.45 | Trendless | Extremely low reading confirms a lack of directional trend. |
| MA50 Gap | -2.43% | Bearish Pressure | Price is struggling significantly below the 50-day average. |
The Trendless Abyss Revealed by an Anemic ADX
The Average Directional Index (ADX) reading of 13.45 is not merely a data point; it is a declaration of market apathy. Any value below 20, particularly one this low, signals a complete absence of a discernible trend. This environment is treacherous for trend-following strategies and favors range-trading or volatility-based approaches. The current price action is effectively noise within a consolidation pattern, awaiting a significant catalyst to establish direction. This period of significant volume contraction, currently at 71% of the norm, often precedes a sharp, decisive move as energy is coiled.
A Coiled Spring in Momentum Indicators
The market is sending a clear message of indecision. With an RSI of 49.59 and a CCI of -14.90, momentum oscillators are pinned to the neutral line. This indicates a perfect balance between buying and selling pressure. Such equilibrium is inherently unstable and suggests the market is building cause for a more significant future effect. The MACD oscillator's slight positive value of 0.431 is a minor bullish whisper in a silent room—noteworthy, but not yet actionable without confirmation from price and volume.
Dissecting the Moving Average Tension
| Moving Average | Value | Price Gap | Strategic Implication |
|---|---|---|---|
| MA20 | $209.37 | +0.19% | Short-term support is holding, but tenuously. |
| MA50 | $215.00 | -2.43% | Represents the first major overhead resistance. |
| MA100 | $223.87 | -6.30% | A significant barrier indicating a bearish medium-term structure. |
A Strategic Action Plan for a Sideways Market
- Define the Range: Acknowledge the primary trading channel between strong support at $196.00 and initial resistance near the MA50 at $215.00.
- Monitor Breakout Triggers: A daily close above $220 on high volume would signal a potential bullish breakout. Conversely, a close below $196.00 would confirm a bearish continuation.
- Position for Volatility: Given the low ADX, consider options strategies like straddles or strangles that profit from an increase in volatility, regardless of direction.
- Patience is Paramount: Avoid initiating large directional bets within the current range. Wait for the market to signal its intent clearly.
Visualizing the Key Price Battlegrounds
[Chart] Visualization of AMZN's current price relative to the 120-day high (resistance) and low (support), highlighting the consolidation zone.
The Deceptive Calm of Low Volume
The current volume of 31.45 million shares, sitting at just 71% of its average, is a critical piece of the puzzle. In a downtrend or consolidation phase, low volume can be interpreted as a drying up of selling pressure. However, it also signifies a lack of institutional buying interest. This creates a fragile state where a sudden influx of capital, either buying or selling, can cause an outsized price movement. Traders must watch for any volume spike as a potential confirmation of an impending volatility expansion and the true start of a new directional leg.
Future Scenarios Under a Quant Lens
| Scenario | Probability | Price Target | Key Triggers & Catalysts |
|---|---|---|---|
| Base Case (Sideways) | 55% | $196 - $220 | ADX remains below 20; price fails to break key levels on volume. |
| Bull Case (Breakout) | 30% | $235 | Close above $220 with >120% average volume; MACD expands positively. |
| Bear Case (Breakdown) | 15% | $185 | Close below $196 support; RSI breaks below 40; negative news catalyst. |