Quant Dashboard: TSLA's Current Battleground
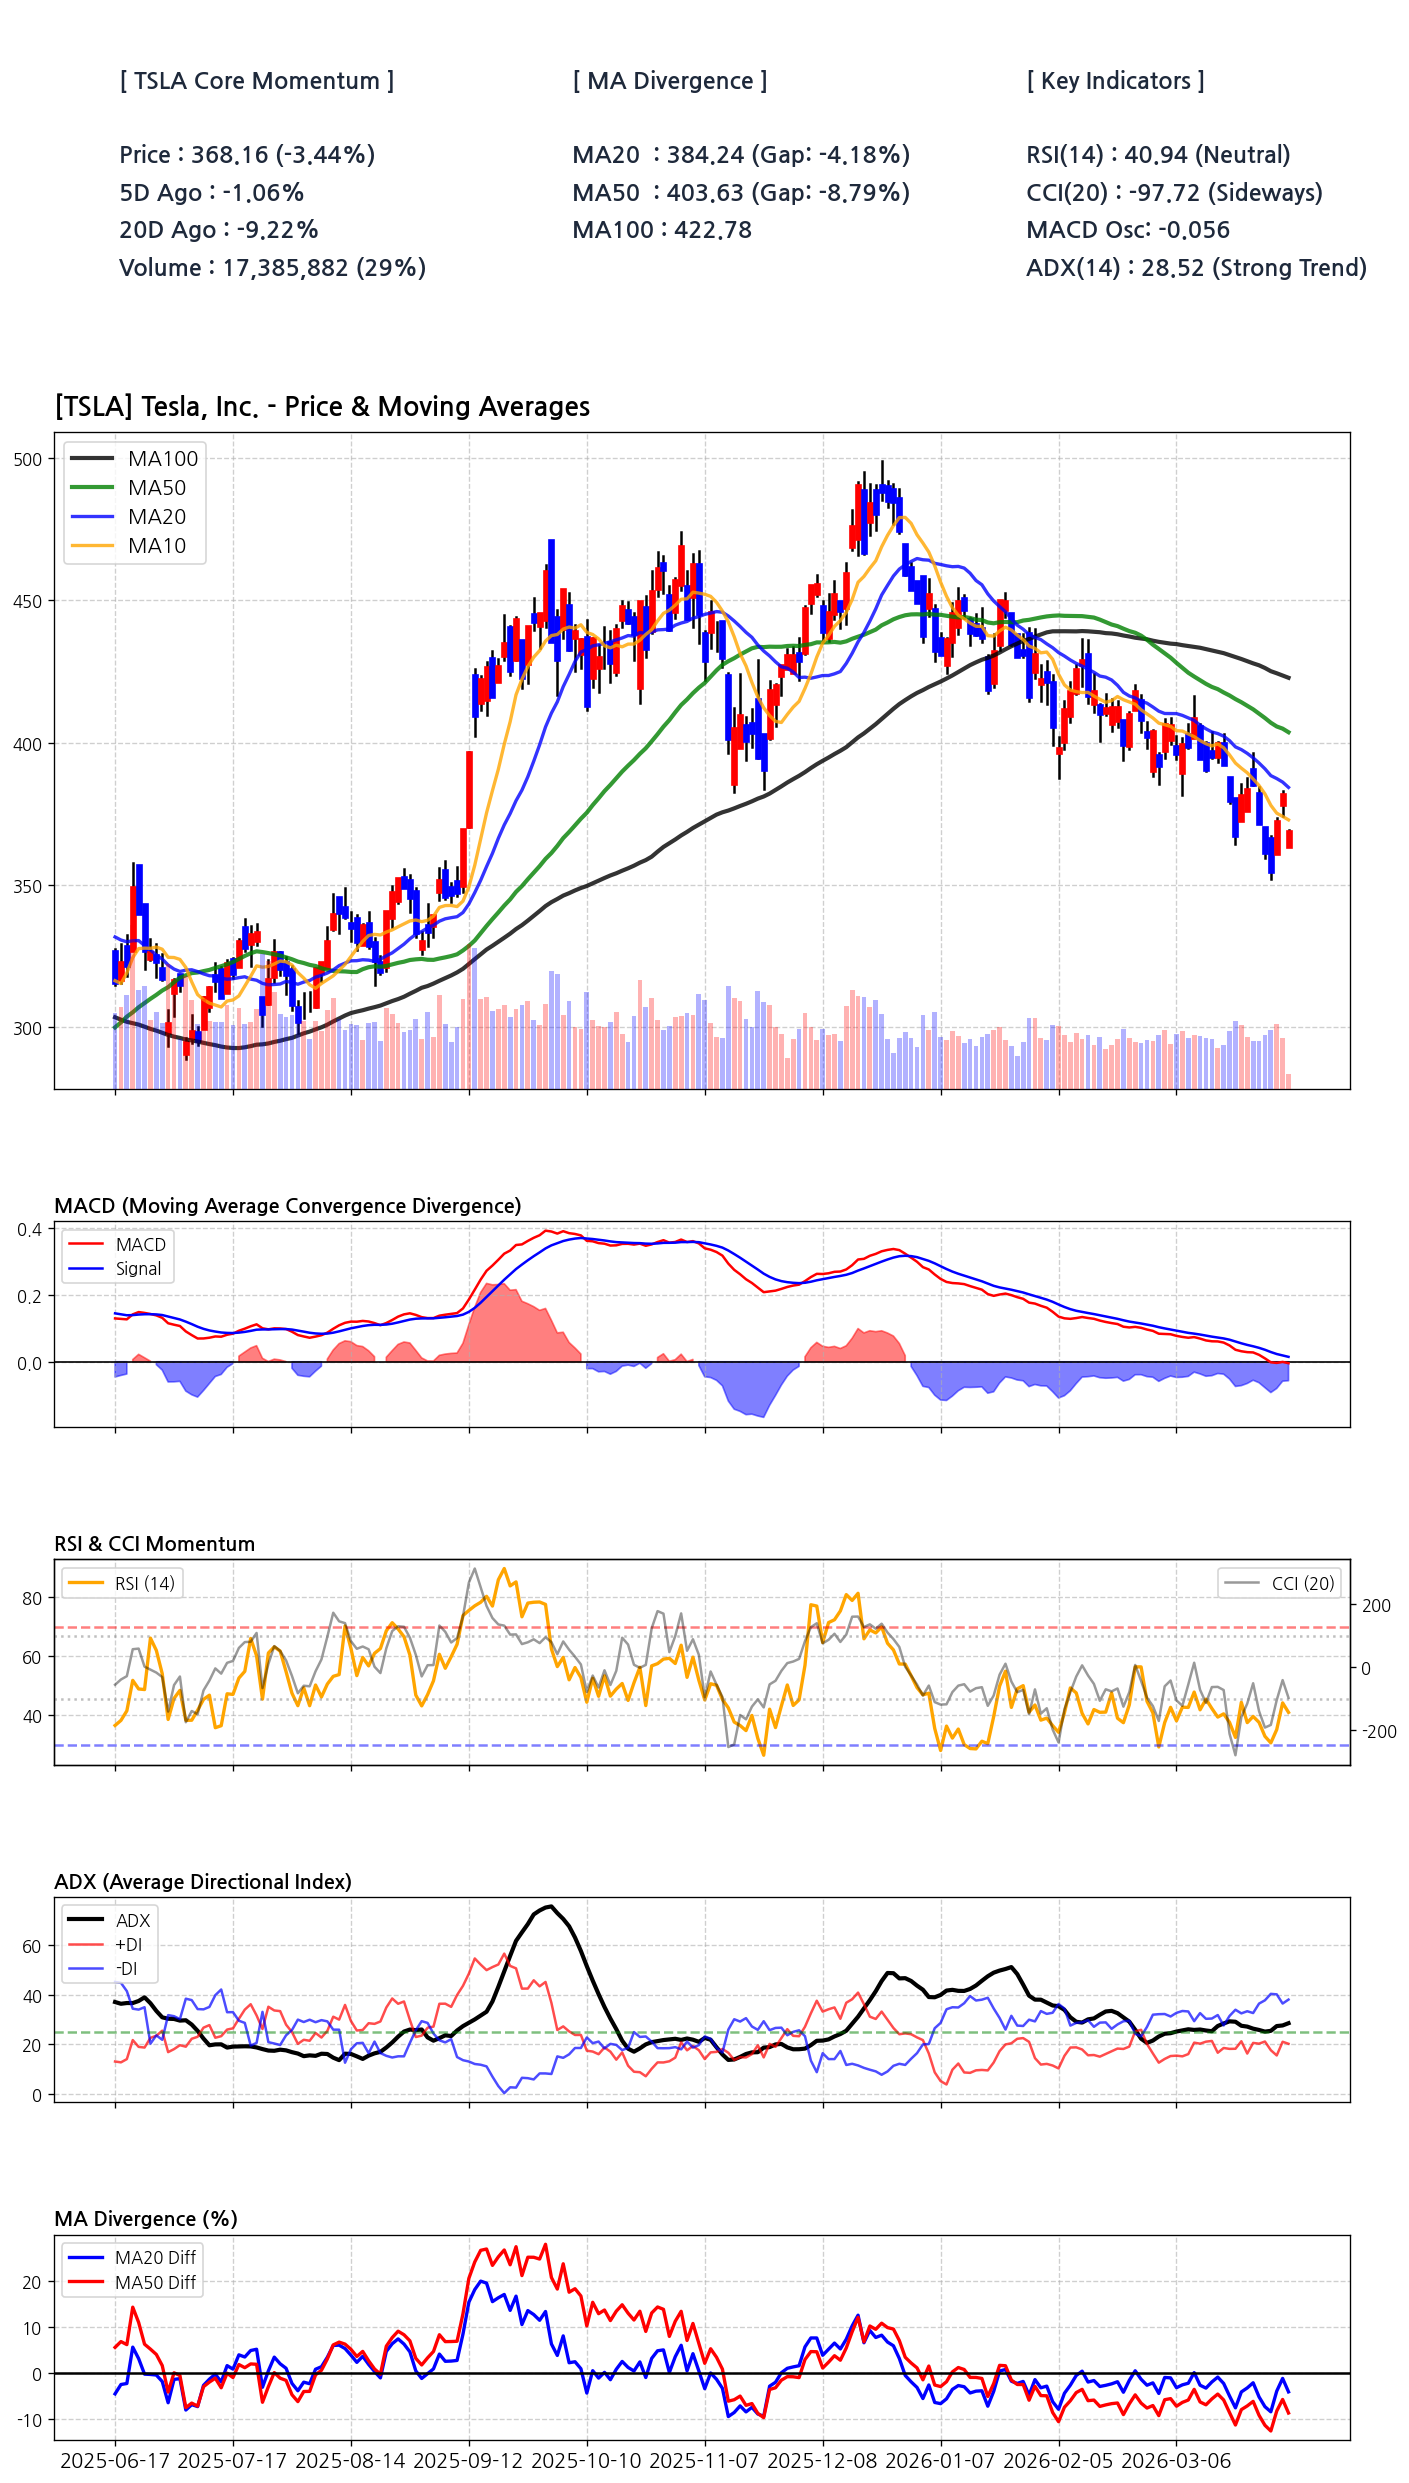
The immediate data paints a precarious picture. A significant price drop is coupled with technical indicators that validate the strength of this downward move. The widening gap between the price and its 20-day moving average (-4.18%) signals accelerating negative momentum, a critical warning for any short-term bullish thesis.
| Metric | Value | Indication | Commentary |
|---|---|---|---|
| Price | $368.16 | -3.44% | Strong downward pressure |
| MA20 Divergence | -4.18% | Bearish | Price is significantly below short-term trend |
| RSI (14) | 40.94 | Neutral | Nearing oversold, but no reversal signal yet |
| ADX (14) | 28.52 | Strong Trend | Confirms the validity of the current downtrend |
The Anatomy of a Downtrend: Decoding Moving Average Gaps
The current chart structure for TSLA is a textbook example of bearish alignment. The faster moving averages (MA10, MA20) are trading decisively below the slower ones (MA50, MA100), creating a classic 'death cross' formation that often precedes further declines. The MA Divergence chart confirms this, with the MA20 and MA50 difference plunging into negative territory. This isn't a minor dip; it's a structural shift in trend that suggests overhead supply will cap any rally attempts near the $385-$400 resistance zone.
Mapping Key Price Levels and Implied Volatility
[Chart] Visualization of TSLA's critical support and resistance zones. The stock is currently trading below key moving average clusters, with primary support located near the $350-$355 range and formidable resistance overhead.
A Chorus of Caution from Market Narratives
The recent string of negative headlines, particularly the Q1 delivery miss, provides fundamental validation for the technical breakdown. Markets are forward-looking, and the data suggests a narrative shift from 'growth at any cost' to concerns over global demand-side deterioration and competitive pressures. This sentiment acts as a powerful headwind against any technical bounce.
The Quant's Probabilistic Scenarios
Absolute predictions are a fool's errand. Strategy is built on probabilities. The current data overwhelmingly favors the bearish scenario in the short-to-medium term, with a low probability of a V-shaped recovery without a major, unforeseen catalyst.
| Scenario | Probability | Price Target | Key Drivers & Assumptions |
|---|---|---|---|
| Bear Case | 60% | $320 - $350 | Breach of $355 support; continued negative news flow; broad market weakness. |
| Base Case | 30% | $350 - $390 | Support at $355 holds; stock enters a consolidation range; capped by MA20/MA50 resistance. |
| Bull Case | 10% | $420+ | Strong positive catalyst (e.g., FSD breakthrough, surprise earnings beat); reversal of ADX trend. |
Indicator Dissonance Reveals the True Trend
While an RSI of 40.94 might tempt bottom-fishers, it is a subordinate indicator in this context. The ADX at 28.52 is the dominant signal, indicating the *strength* of the prevailing downtrend is robust. An ADX above 25 confirms that this is not directionless chop but a committed move lower. The MACD oscillator's negative value further corroborates this bearish momentum, suggesting sellers remain in firm control.
Fundamental Cracks Begin to Surface
The technical weakness is not occurring in a vacuum. The quant report highlights several concerning fundamental trends that justify the market's re-pricing of the stock, which still trades at a significant valuation premium relative to its growth profile.
- Negative Revenue Growth: A YoY revenue decline of -3.10% is a major red flag for a company priced for hyper-growth.
- Earnings Misses: Failing to meet EPS estimates in three of the last four quarters erodes investor confidence and signals execution challenges.
- High Valuation: A trailing P/E of 344 and PBR of 16.82 offer little margin of safety if growth continues to decelerate.
Wall Street's Disconnect with On-Chart Reality
The consensus analyst price target presents an interesting divergence. While the Street sees long-term value, their targets often lag price action. A quant approach prioritizes the current, unfolding data over potentially stale analyst models.
| Metric | Value |
|---|---|
| Current Price | $368.16 |
| Consensus Target | $418.83 |
| Implied Upside | +13.73% |
| Highest Target | $600.00 |