Quant Dashboard: MSFT's Current Technical State
| Metric | Value | Status | Implication |
|---|---|---|---|
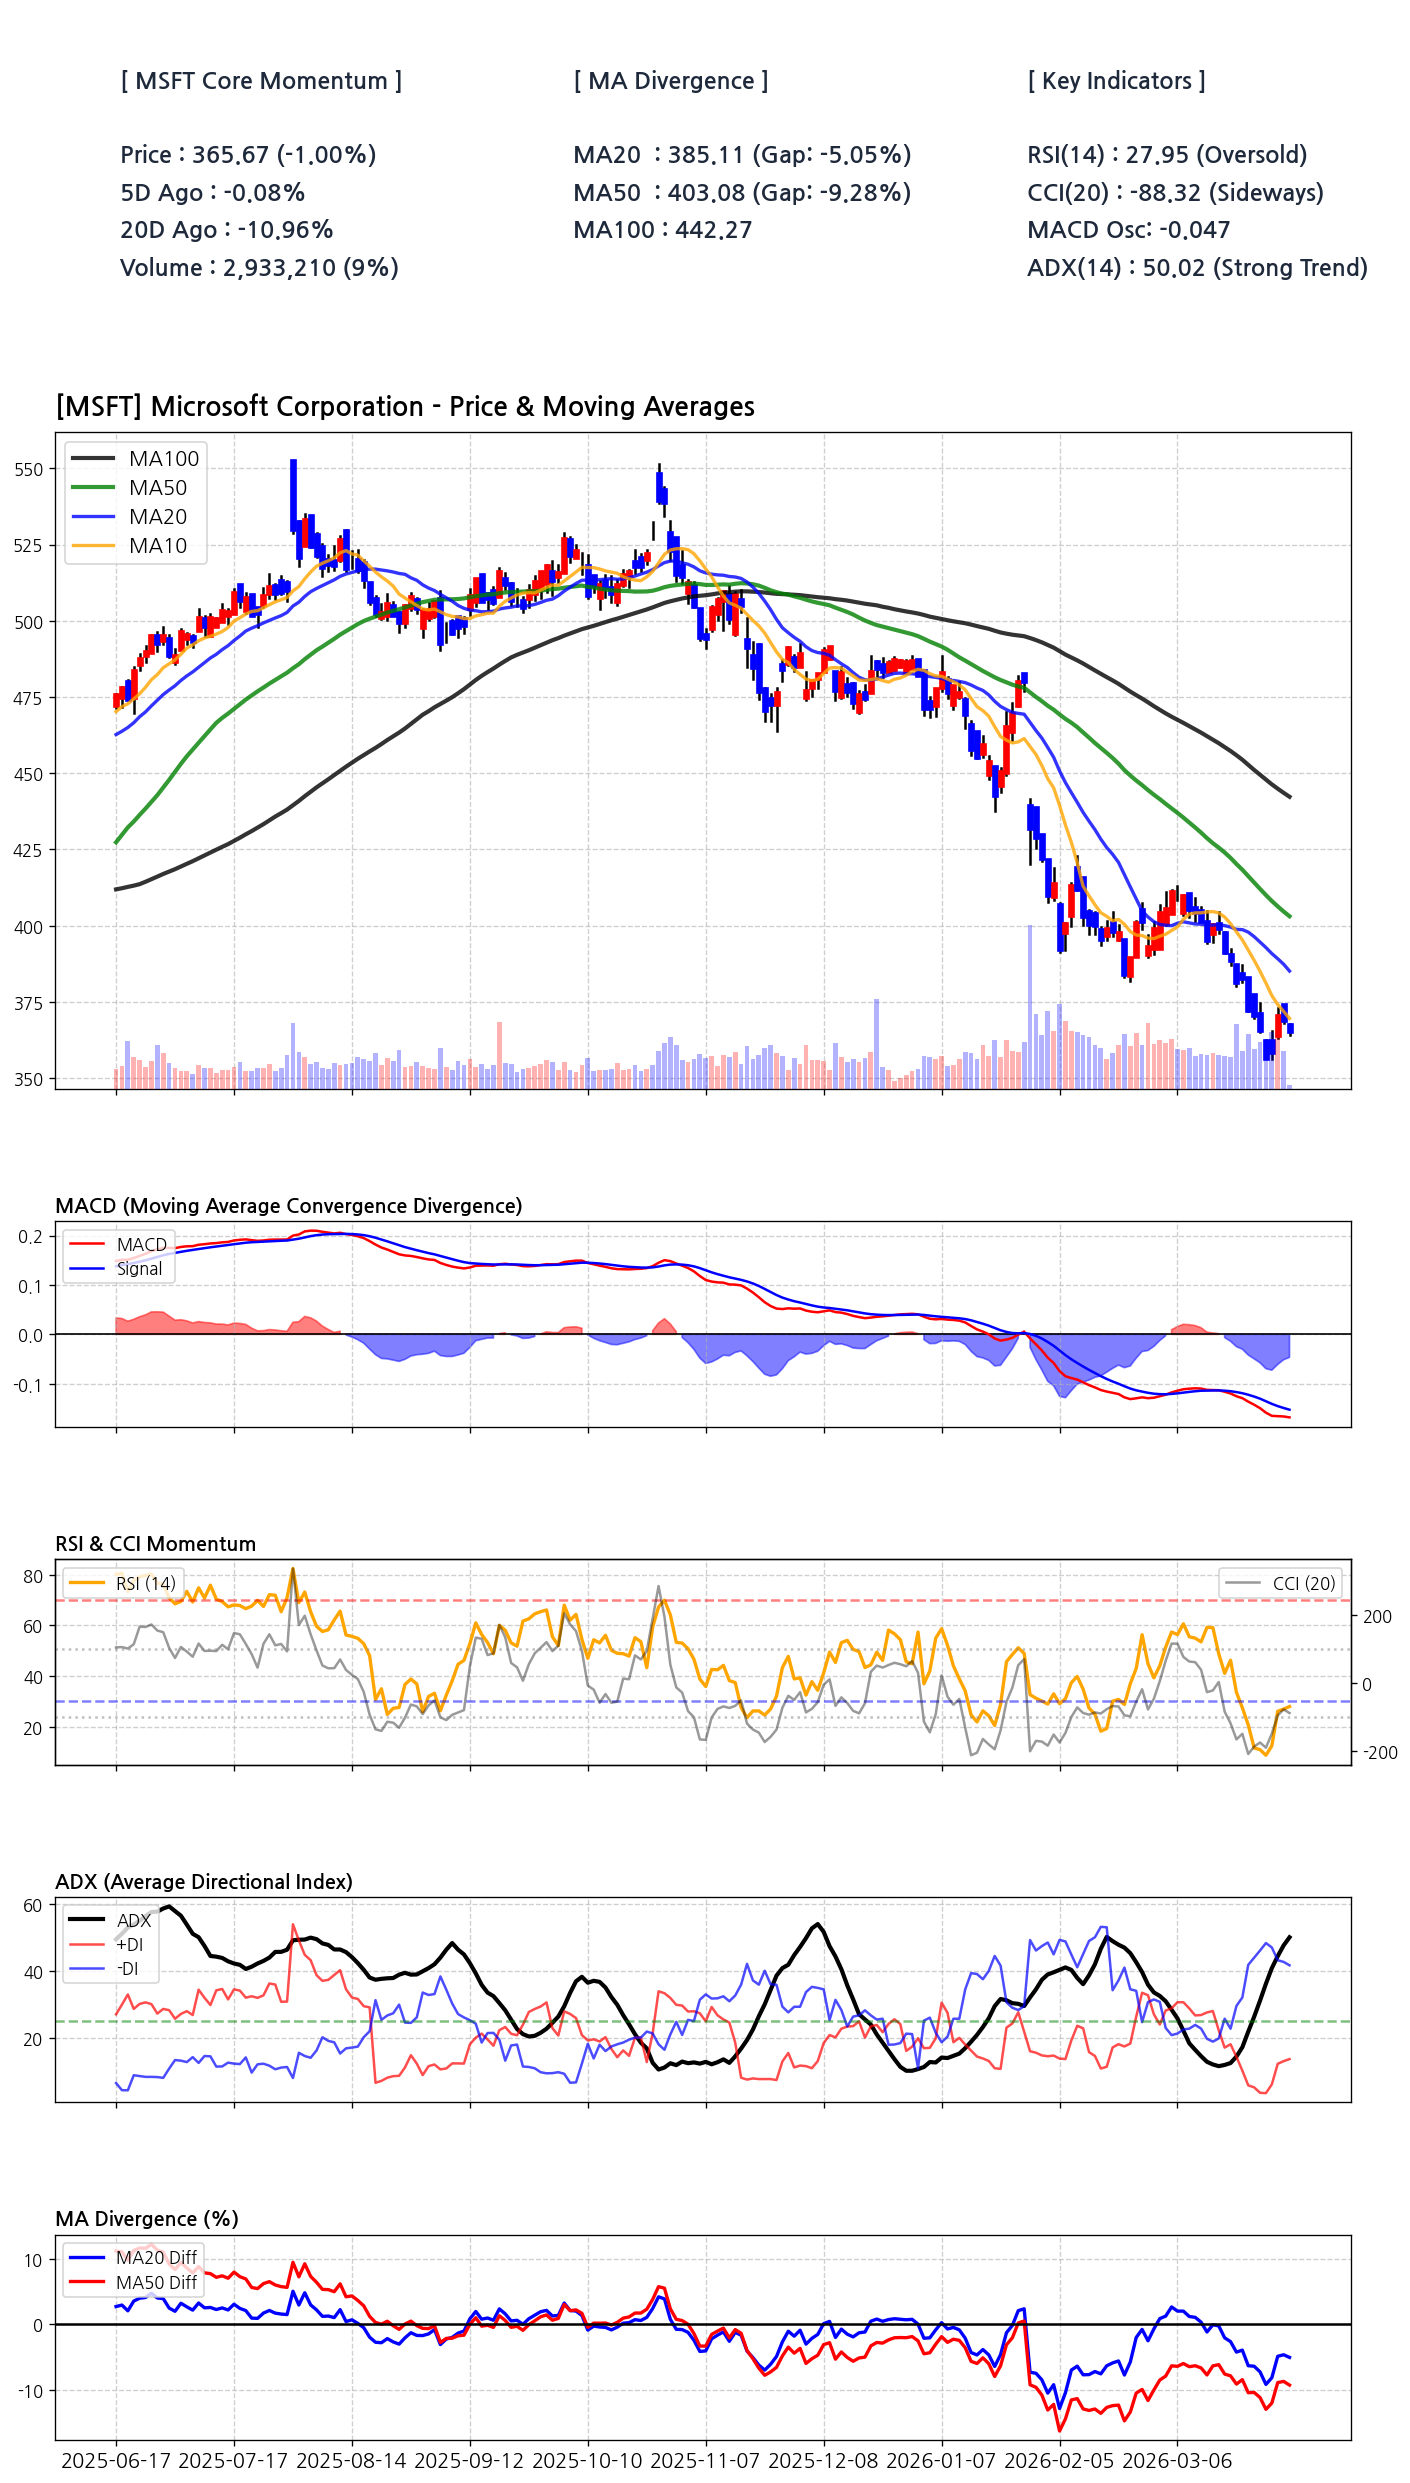
| Last Price | $365.67 (-1.00%) | Bearish | Price is below all key moving averages. |
| RSI (14) | 27.95 | Oversold | Potential for a short-term counter-trend bounce. |
| ADX (14) | 50.02 | Strong Trend | The current downtrend has exceptional strength. |
| MA20 Divergence | -5.05% | Very Bearish | Significant deviation below the 20-day average. |
| MACD Oscillator | -0.047 | Bearish | Downward momentum is firmly established. |
The ADX Confirms a Brutal, Unwavering Downtrend
The Average Directional Index (ADX) has surged to 50.02, a level that signifies an exceptionally strong and mature trend. This is not noise; it is a clear quantitative signal that the prevailing downward trajectory has significant force behind it. With the -DI line far above the +DI, the direction of this trend is unambiguously bearish. Traders attempting to catch a falling knife in this environment face substantial risk, as such a powerful momentum reading often precedes further price depreciation, even from oversold levels.
Microsoft just saw its worst quarter on Wall Street in nearly two decades — and investors are paying attention. The tech giant’s stock dropped 23% in the first three months of 2026, the steepest fall since the 2008 financial crisis.
Mapping the Battlefield: Critical Support and Resistance Zones
[Chart] Visualization of key price levels for Microsoft. The immediate resistance is the 20-day moving average around $385, while psychological and technical support lies near $350 and $340, respectively. These zones are critical for defining risk and potential reversal points.
Probabilistic Scenarios for the Next 6-12 Months
| Scenario | Probability | Price Target | Core Thesis |
|---|---|---|---|
| Bear Case | 50% | $310 - $340 | Trend momentum continues; oversold bounces are sold into. Macro headwinds persist. |
| Base Case | 35% | $350 - $410 | Price stabilizes in a range after capitulation. Fundamentals provide a floor. |
| Bull Case | 15% | $440+ | A strong positive catalyst forces a sharp reversal, breaking above the MA50. |
Coiled Springs in the Abyss: Oversold Indicators Signal a Volatility Spike
- RSI Below 30: The Relative Strength Index at 27.95 is in classic oversold territory. Historically, this condition doesn't guarantee a reversal but increases the probability of a sharp, albeit potentially brief, relief rally.
- CCI Deeply Negative: The Commodity Channel Index at -88.32, having recently been below -200, indicates extreme deviation from the statistical mean. This reflects capitulatory selling pressure.
- Combined Signal: The confluence of these oversold readings suggests that downside momentum may be reaching an exhaustive peak. This creates a fertile ground for a violent counter-trend move, which could trap late short-sellers. Prudent strategy involves waiting for a confirmation of a bottom rather than preemptively buying.
The Great Disconnect Between Fundamentals and Technicals
A chasm has opened between Microsoft's robust financial health and its collapsing stock price. While technical indicators scream crisis, the company's fundamentals paint a picture of a resilient powerhouse. The operating margin of 47% and ROE of 34% are elite. This fundamental-technical divergence is unsustainable long-term. The key question is timing: either the price will eventually revert to reflect its fundamental strength, or the market is pricing in a future deterioration of those fundamentals not yet visible in the data.
Are Institutional Investors Capitulating?
Analyzing the positioning of 'Smart Money'
With institutional ownership at a high of 75.95%, the behavior of large funds like Vanguard and Blackrock is paramount. The current sell-off is likely a combination of portfolio rebalancing, profit-taking after a long run-up, and hedging against macroeconomic uncertainty. A true institutional capitulation would likely involve even higher volume spikes and a break of major psychological levels like $300. For now, the data suggests a severe correction within a long-term holding pattern, not a wholesale abandonment of the stock by its largest backers.