The Analog Moat Faces a Cyclical Tide
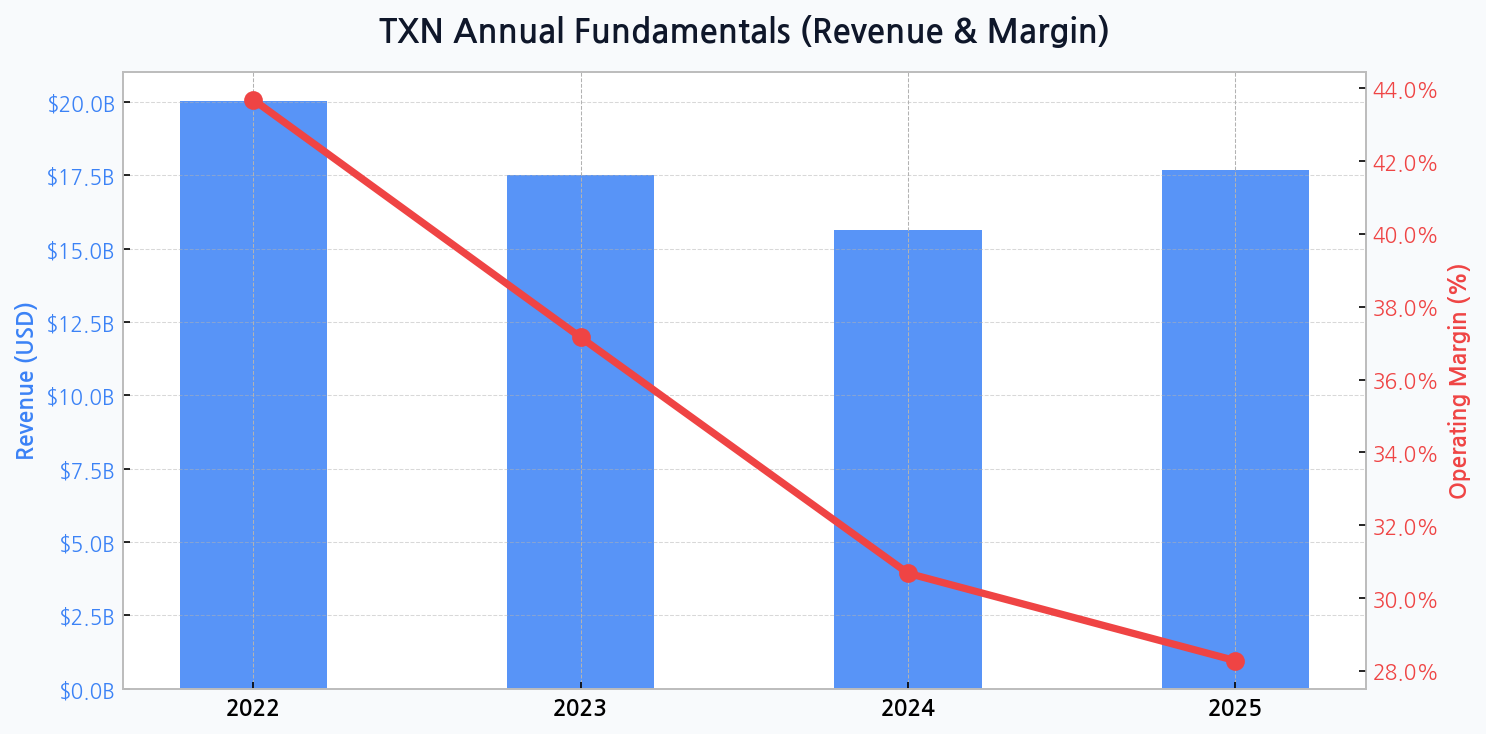
Texas Instruments' long-standing dominance in the analog semiconductor space is undeniable, yet it's not immune to market cycles. The firm's revenue trajectory, falling from a high of $20.0B in 2022 to a projected $15.6B in 2024 before a slight recovery to $17.7B in 2025, illustrates a significant industry-wide correction. This downturn tests the resilience of its vaunted business model.
Automotive & Industrial Segments: The Bedrock of Cash Flow
Despite near-term volatility, the company's strategic pivot towards long-cycle end markets like automotive and industrial automation remains its core strength. These segments demand high-performance, mission-critical analog and embedded processors, creating a sticky customer base and a predictable, albeit currently pressured, stream of free cash flow. This focus is the primary defense against commoditization.
| Segment | Est. 2023 Revenue Share | Growth Outlook (3-Yr) | Strategic Importance |
|---|---|---|---|
| Industrial | ~ 42% | Moderate | High (Diversified) |
| Automotive | ~ 27% | High | Very High (Growth Driver) |
| Personal Electronics | ~ 20% | Low | Declining |
| Other | ~ 11% | Stable | Moderate |
DIFF Insight: This breakdown underscores the intentional shift away from volatile consumer electronics towards more stable, higher-margin industrial and automotive applications. The success of this strategy is paramount, as weakness in these core areas would signal a fundamental threat to the company's FCF generation thesis and long-term valuation.
Margin Erosion Signals a Shifting Competitive Landscape
The most alarming trend is the severe compression of operating margins, plummeting from 43.7% in 2022 to a forecasted 28.3% by 2025. This isn't just a revenue issue; it points to pricing pressure, unfavorable product mix, and the high costs associated with underutilized new manufacturing capacity. This trend challenges the narrative of an impenetrable competitive moat.
[Chart] Total Assets (Bar) & Debt Ratio (Line) for TXN
The Strategic Dilemma of Rising Financial Leverage
To support its long-term manufacturing roadmap, TXN's balance sheet is undergoing a significant transformation. The debt ratio is on a clear upward path, climbing from 46.4% in 2022 to an estimated 52.9% in 2025, while total assets expand. This aggressive capital expenditure cycle is a bet that future demand will justify the current financial strain.
Capital Allocation Under Intense Scrutiny
Wall Street is watching closely. Can TXN maintain its generous shareholder returns through dividends and buybacks while funding the most ambitious capacity expansion in its history? The next 24 months will reveal whether this is a stroke of genius or a costly miscalculation of the cycle's depth.
Competitor Pressure Mounts in a Saturated Market
While TXN is a leader, it doesn't operate in a vacuum. Competitors like Analog Devices and NXP Semiconductors are also vying for dominance in the same lucrative automotive and industrial markets. A comparison of valuation multiples reveals how the market is pricing these different strategies amid the downturn.
| Metric | Texas Instruments (TXN) | Analog Devices (ADI) | NXP Semi (NXPI) |
|---|---|---|---|
| Forward P/E | ~ 28x | ~ 22x | ~ 18x |
| Price/Sales (TTM) | ~ 9.5x | ~ 9.0x | ~ 5.5x |
| EV/EBITDA | ~ 20x | ~ 18x | ~ 14x |
DIFF Insight: TXN consistently trades at a premium to its peers, a testament to its historical profitability and market leadership. However, as its margin profile begins to converge with competitors', this valuation premium could come under significant pressure if it fails to demonstrate a clear path back to its historical profitability levels.
Geopolitical Risks Reshape the Supply Chain
The global push for supply chain sovereignty, particularly in the US and Europe, is a double-edged sword. While it provides opportunities for government incentives (e.g., CHIPS Act), it also necessitates a costly and complex restructuring of manufacturing footprints. This geopolitical fragmentation introduces new operational risks and capital demands that were not present five years ago.
| Risk Factor | Probability | Impact Severity | Mitigation Strategy |
|---|---|---|---|
| Prolonged Demand Slump | Medium | High | Inventory Management |
| Geopolitical Trade Curbs | Medium | High | Geographic Fab Diversification |
| Execution on New Fabs | Low | Very High | Phased Ramp-up, Experienced Teams |
| Aggressive Price Competition | High | Medium | Focus on Proprietary Products |
DIFF Insight: The primary operational risk is a mis-timing of the economic cycle, where massive new capacity comes online just as demand remains weak, further crushing margins. The geopolitical factor, especially concerning China, remains a persistent tail risk that could disrupt both supply and demand channels without warning.
The Path to Recovery Hinges on Disciplined Execution
Navigating this period requires a delicate balance. Management must justify its heavy investments by capturing the next wave of growth while managing investor expectations through the current downturn. The company's ability to manage its strategic inventory buildup will be a key indicator of its operational discipline.
- Secure design wins in next-generation electric vehicles and factory automation.
- Efficiently ramp up new 300mm wafer fabs to bring down long-term production costs.
- Maintain dividend growth to appease long-term income-oriented investors.
- Avoid value-destructive M&A during a period of high capital intensity.