The Dawn of a Focused Aerospace Titan
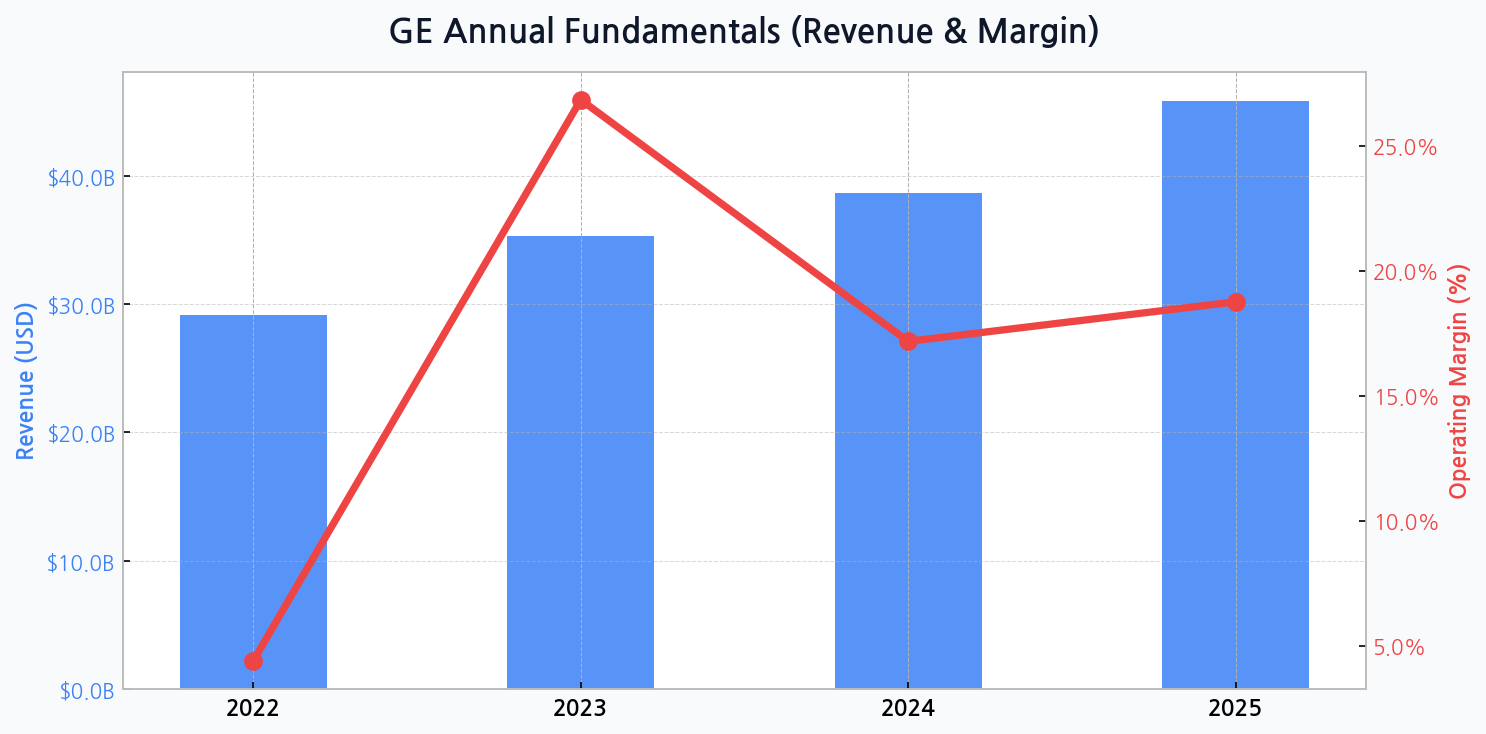
With its final spinoff complete, GE Aerospace now operates with a sharpened focus on the highly lucrative aviation market. The financial trajectory shows a powerful revenue uplift, jumping from $29.1 billion in 2022 to a projected $45.9 billion by 2025. This growth narrative, however, is punctuated by margin volatility; the leap to an exceptional 26.8% margin in 2023 appears anomalous, with forecasts normalizing to 17.2% in 2024 and a healthier 18.8% in 2025, signaling the end of spinoff-related financial adjustments and a return to core operational performance.
Gauging Value in a Concentrated Market
As a pure-play leader, GE's valuation is now more directly comparable to its aerospace peers. The company's primary strength lies in its unrivaled installed base of commercial and military engines, which guarantees a long-tail, high-margin revenue stream from services and spare parts for decades. This creates a formidable economic moat that competitors find nearly impossible to breach.
| Metric | GE Aerospace (GE) | RTX Corp (RTX) | Safran (SAF) |
|---|---|---|---|
| Forward P/E | ~ 35.1x | ~ 18.5x | ~ 23.0x |
| EV/EBITDA | ~ 22.4x | ~ 12.1x | ~ 14.5x |
| Dividend Yield | ~ 0.5% | ~ 2.3% | ~ 1.0% |
DIFF Insight: The market is awarding GE a significant valuation premium over its key competitors, RTX and Safran. This suggests investors are pricing in future growth from the aviation super-cycle and the high-margin aftermarket business. However, this premium also implies immense pressure on management to deliver on margin expansion and earnings growth to justify such a high multiple.
The Lingering Shadow of Debt
Despite shedding non-core assets, GE carries a significant debt burden. The company's debt ratio is projected to climb from 81.5% in 2022 to 85.5% by 2025. This rising leverage, coupled with a shrinking asset base from $188.9 billion to a projected $130.2 billion over the same period, creates a precarious financial balancing act. Managing this debt will be a critical test of leadership's capital allocation strategy.
[Chart] Total Assets (Bar) & Debt Ratio (Line) for GE
[Chart] GE's annual revenue shows a strong upward trend, while operating margin displays significant volatility, peaking in 2023 before stabilizing at a lower but still healthy level.
An Unsettled Global Supply Chain
The single biggest threat to the aerospace recovery isn't demand; it's the industry's ability to execute. Forging bottlenecks, casting shortages, and skilled labor gaps are creating a production environment where meeting targets is a constant battle, directly impacting costs and delivery schedules for giants like GE.
Pillars of Future Growth and Profitability
GE's long-term strategy rests on three core pillars that must be executed flawlessly to reward shareholders and solidify its market dominance.
- Aftermarket Dominance: Capitalizing on the post-pandemic travel rebound by maximizing high-margin service contracts and spare part sales for its massive fleet of existing engines.
- Next-Generation Propulsion: Aggressively investing in R&D, particularly the CFM RISE program, to develop more fuel-efficient and sustainable engine technologies that will define the next era of aviation.
- Operational Excellence: Driving lean manufacturing principles throughout the organization to combat inflation, improve production efficiency, and expand operating margins organically.
Unpacking the Revenue Engine
The company's revenue is not monolithic. The true engine of profitability is the services segment, which offers significantly higher margins than new engine sales. The defense sector provides a stable, counter-cyclical buffer, but the powerful aftermarket revenue stream from the commercial fleet is the key driver of GE's financial performance and valuation.
| Business Segment | Est. Revenue Contribution | Margin Profile | Growth Outlook |
|---|---|---|---|
| Commercial Engines | ~ 40% | Low-to-Mid | Strong |
| Aftermarket Services | ~ 45% | High | Very Strong |
| Defense & Systems | ~ 15% | Mid | Stable |
DIFF Insight: This breakdown illustrates why investors are so focused on GE. While new engine sales drive future service opportunities, it's the recurring, high-margin aftermarket business that fuels cash flow and profit growth. Any slowdown in global flight hours or pressure on service pricing poses a direct threat to this model.
Navigating a Minefield of External Risks
Beyond internal execution, GE's success is tied to a host of external factors that are largely outside of its control. Geopolitical instability, particularly concerning the supply of critical materials like titanium, and macroeconomic headwinds could derail growth projections. The persistent supply chain fragility remains the most immediate operational threat, capable of creating costly production delays and straining relationships with key airframe customers like Boeing and Airbus.
| Threat | Probability | Potential Impact |
|---|---|---|
| Severe Supply Chain Disruption | Medium | High |
| Global Recession Impacting Air Travel | Low-Medium | High |
| Competitor R&D Breakthrough | Low | Medium |
| Major Geopolitical Conflict | Low | High |
DIFF Insight: The risk matrix highlights that GE's primary vulnerabilities are operational and macroeconomic rather than competitive. While its technological moat is strong, its intricate global supply chain is its Achilles' heel. This underscores the importance of diversifying suppliers and building resilience into its manufacturing processes.