Quant Dashboard: NVDA's Vital Signs
| Metric | Current Value | Status | Implication |
|---|---|---|---|
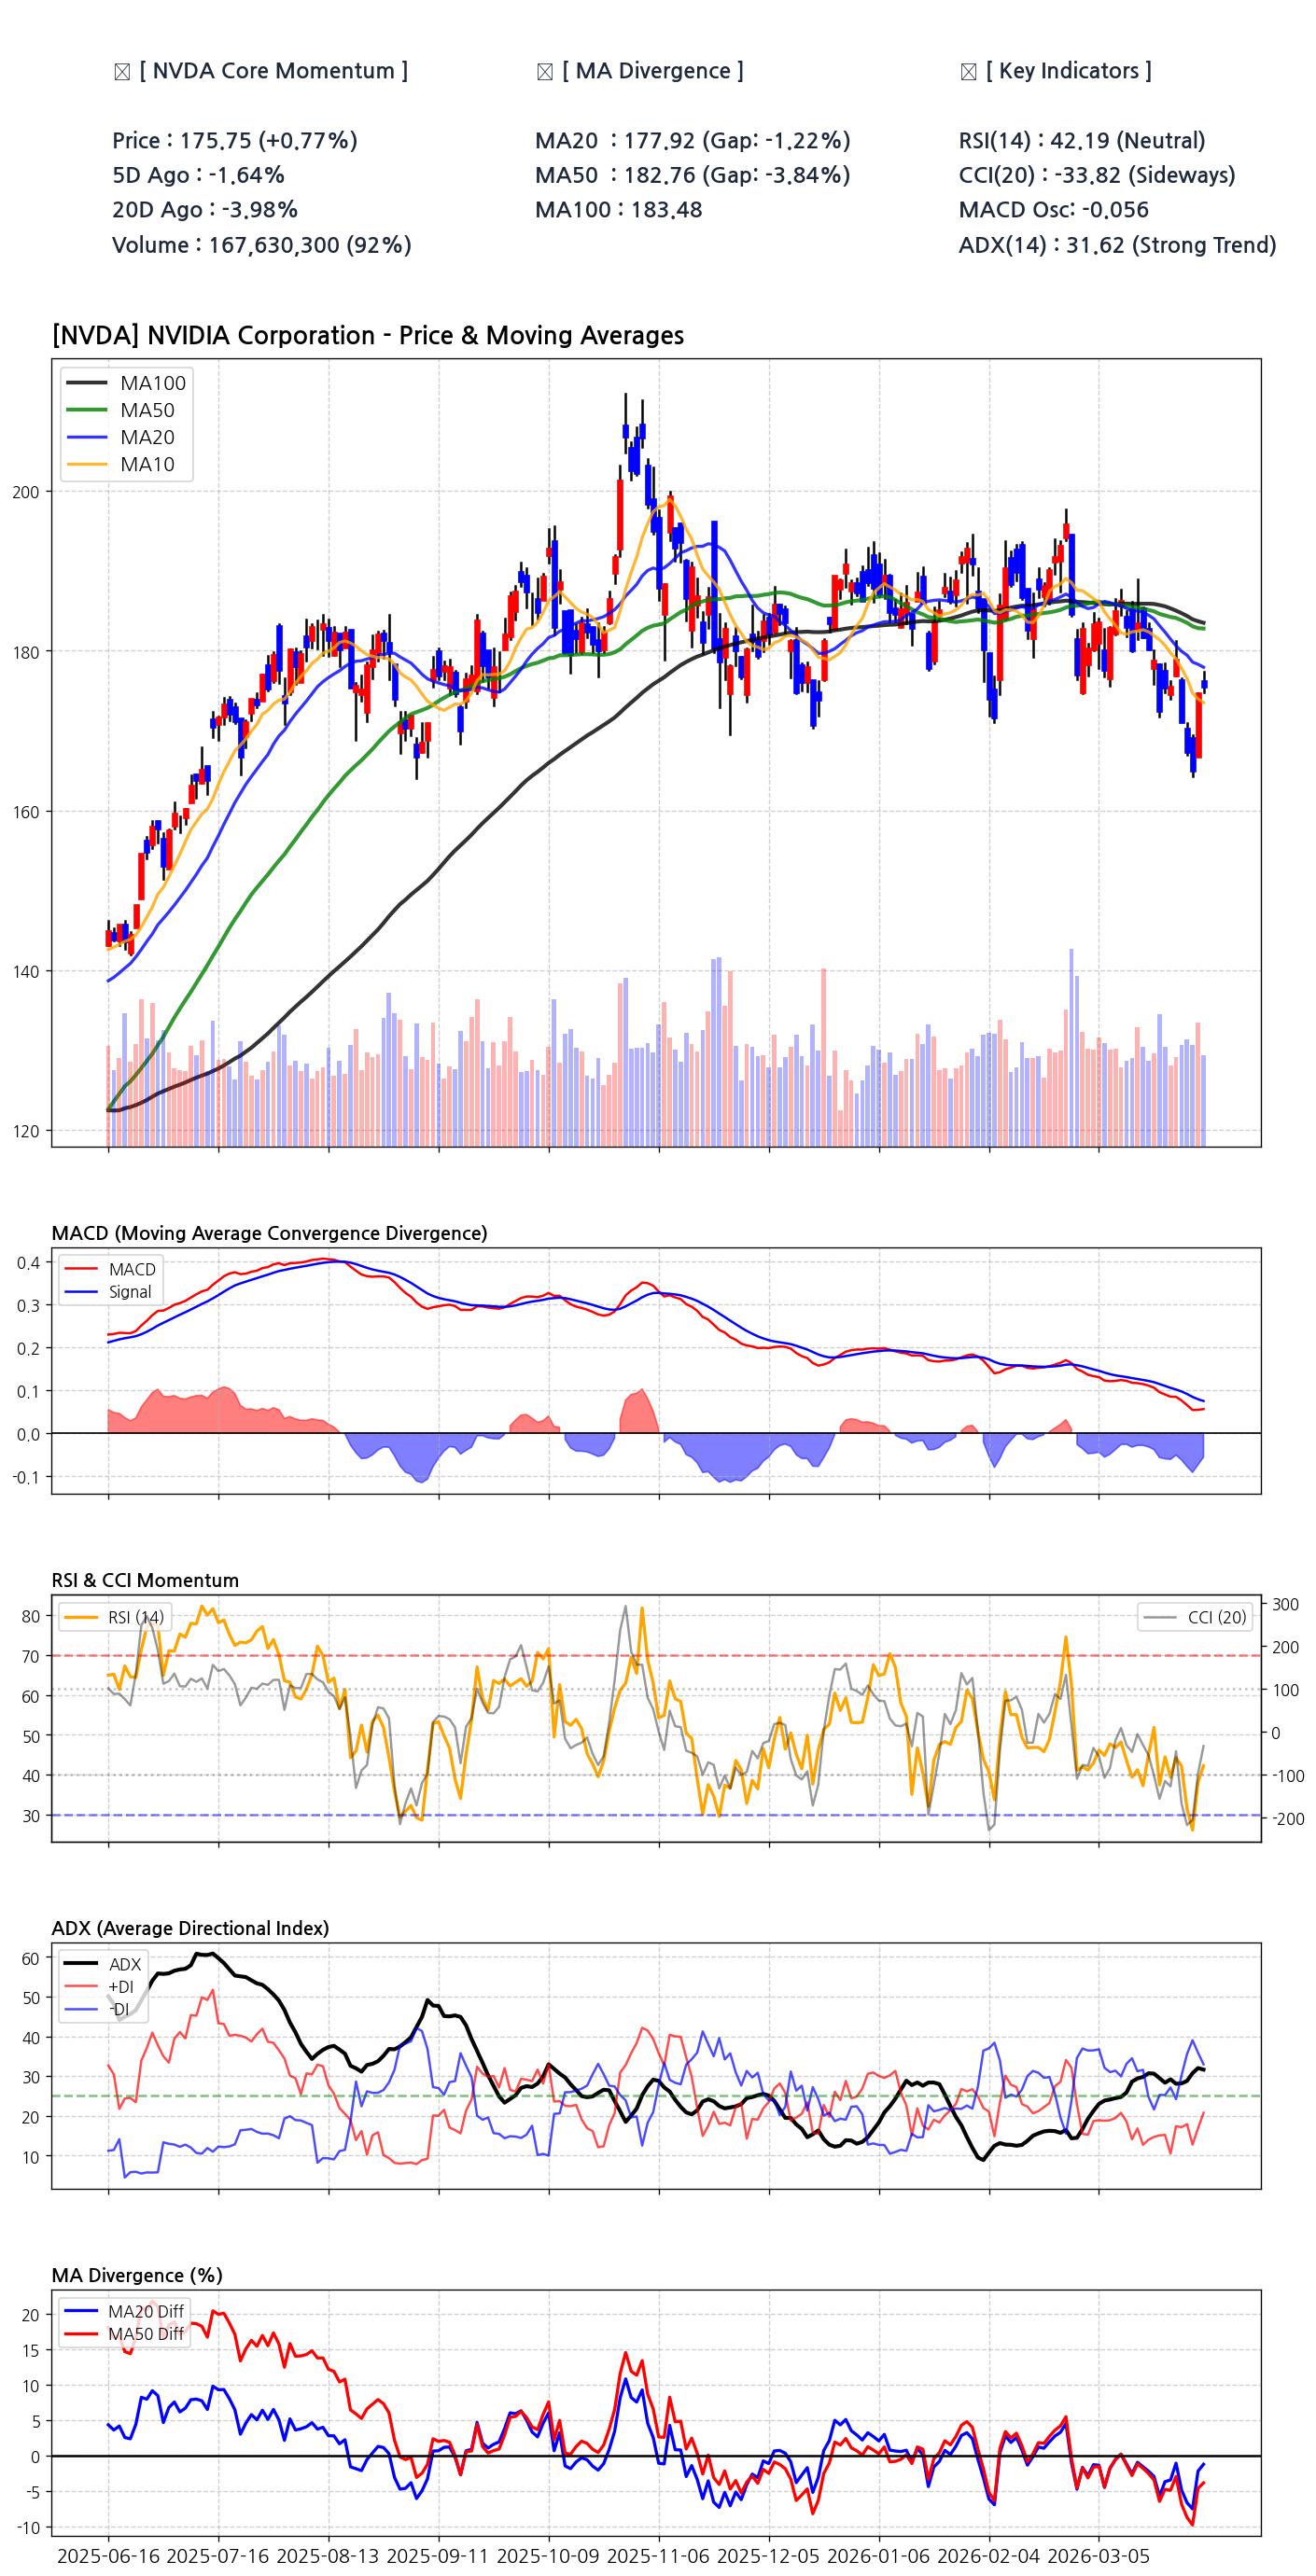
| Price | $175.75 | - | Slight daily gain but below key MAs. |
| MA50 Divergence | -3.84% | Bearish | Significant deviation below the mid-term trend. |
| RSI (14) | 42.19 | Neutral | No immediate overbought/oversold pressure. |
| ADX (14) | 31.62 | Strong Downtrend | Trend strength is high and negative (-DI > +DI). |
| Street Target | $268.22 | Bullish | Massive gap between analyst optimism and reality. |
The Price Structure Has Clearly Broken Down
The current price of $175.75 is trading decisively below the 20-day ($177.92), 50-day ($182.76), and 100-day ($183.48) moving averages. This alignment is a classic technical signal of a shift from a bullish or neutral phase to a confirmed bearish phase. The negative gaps represent a loss of short-term and mid-term momentum, suggesting that sellers are currently in firm control. Any attempt at a rally will face a thicket of resistance at these former support levels.
Technical Indicators Signal a High-Conviction Downtrend
| Indicator | Reading | Interpretation |
|---|---|---|
| ADX (14) | 31.62 | Indicates a strong trend is in place. |
| Directional Index | -DI > +DI | Confirms the strong trend is to the downside. |
| MACD Oscillator | -0.056 | Momentum is negative as the MACD line is below the signal line. |
| CCI (20) | -33.82 | Suggests sideways to weak price action, not yet deeply oversold. |
Wall Street's Optimism Clashes with Market Reality
The chasm between the Wall Street consensus target of $268.22 and the current price is alarming. While analysts maintain 'Buy' ratings, citing phenomenal growth, the tape tells a different story. This highlights a dangerous market divergence where price action has completely decoupled from analyst sentiment, often a precursor to target price revisions downward if technical weakness persists.
The Fundamental Fortress Remains Undeniable
Despite the technical turmoil, the fundamental picture is extraordinary. The company's staggering revenue growth of 73.20% YoY, combined with a jaw-dropping 101.48% Return on Equity, paints a picture of a business at the peak of its powers. This financial strength provides a powerful long-term floor and is the primary argument against a catastrophic, prolonged collapse. The low forward P/E of 15.81 suggests the market has already priced in substantial future earnings, providing a potential valuation backstop.
- Revenue Growth (YoY): 73.20%
- Operating Margin: 65.02%
- Return on Equity (ROE): 101.48%
- Free Cash Flow (FCF): $58.12 Billion
- Current Ratio: 3.90 (Excellent Liquidity)
Probabilistic Scenarios for the Next 3-6 Months
| Scenario | Probability | Price Target | Key Triggers & Conditions |
|---|---|---|---|
| Bear Case | 35% | $155 - $165 | A decisive break below the recent lows around $165. ADX remains above 30 with -DI dominant. |
| Base Case | 45% | $165 - $185 | Choppy consolidation. Price fails to reclaim the 50-day MA but finds support near the $165 level. |
| Bull Case | 20% | $195 - $210 | Price reclaims and holds above the 50-day MA ($182.76) on high volume, triggering a MACD bullish crossover. |
Visualizing Key Battlegrounds for Price Action
[Chart] Key support and resistance levels for NVDA. The price is currently trapped between immediate resistance from moving averages and a critical support level established from recent price lows.
Sentiment Remains Cautious Amidst Broader Market Rebound
Recent news highlights a paradox: while the broader market staged a comeback to end the quarter, NVDA stock tanked 7.6%, significantly underperforming major indices. This relative weakness is a red flag, indicating that capital is rotating out of the name despite its strong narrative. The market is currently rewarding other sectors over this former leader, a trend that could continue until a clear catalyst or technical reversal emerges. This divergence between the company's story and its stock performance represents the central investor dilemma at this moment.
Earnings History Provides a Glimmer of Hope
The only consistent weapon in the bulls' arsenal has been the company's ability to outperform expectations. The persistent earnings surprises, quarter after quarter, demonstrate management's execution capabilities. This track record could provide the necessary catalyst to break the current downtrend during the next earnings cycle, but relying solely on this is a high-risk strategy given the current technical damage.
- 2026-01-31: Beat estimate by +5.32%
- 2025-10-31: Beat estimate by +3.46%
- 2025-07-31: Beat estimate by +4.10%
- 2025-04-30: Beat estimate by +8.02%