Quant Dashboard: AAPL's Current Technical Posture
| Metric | Value | Indication | Commentary |
|---|---|---|---|
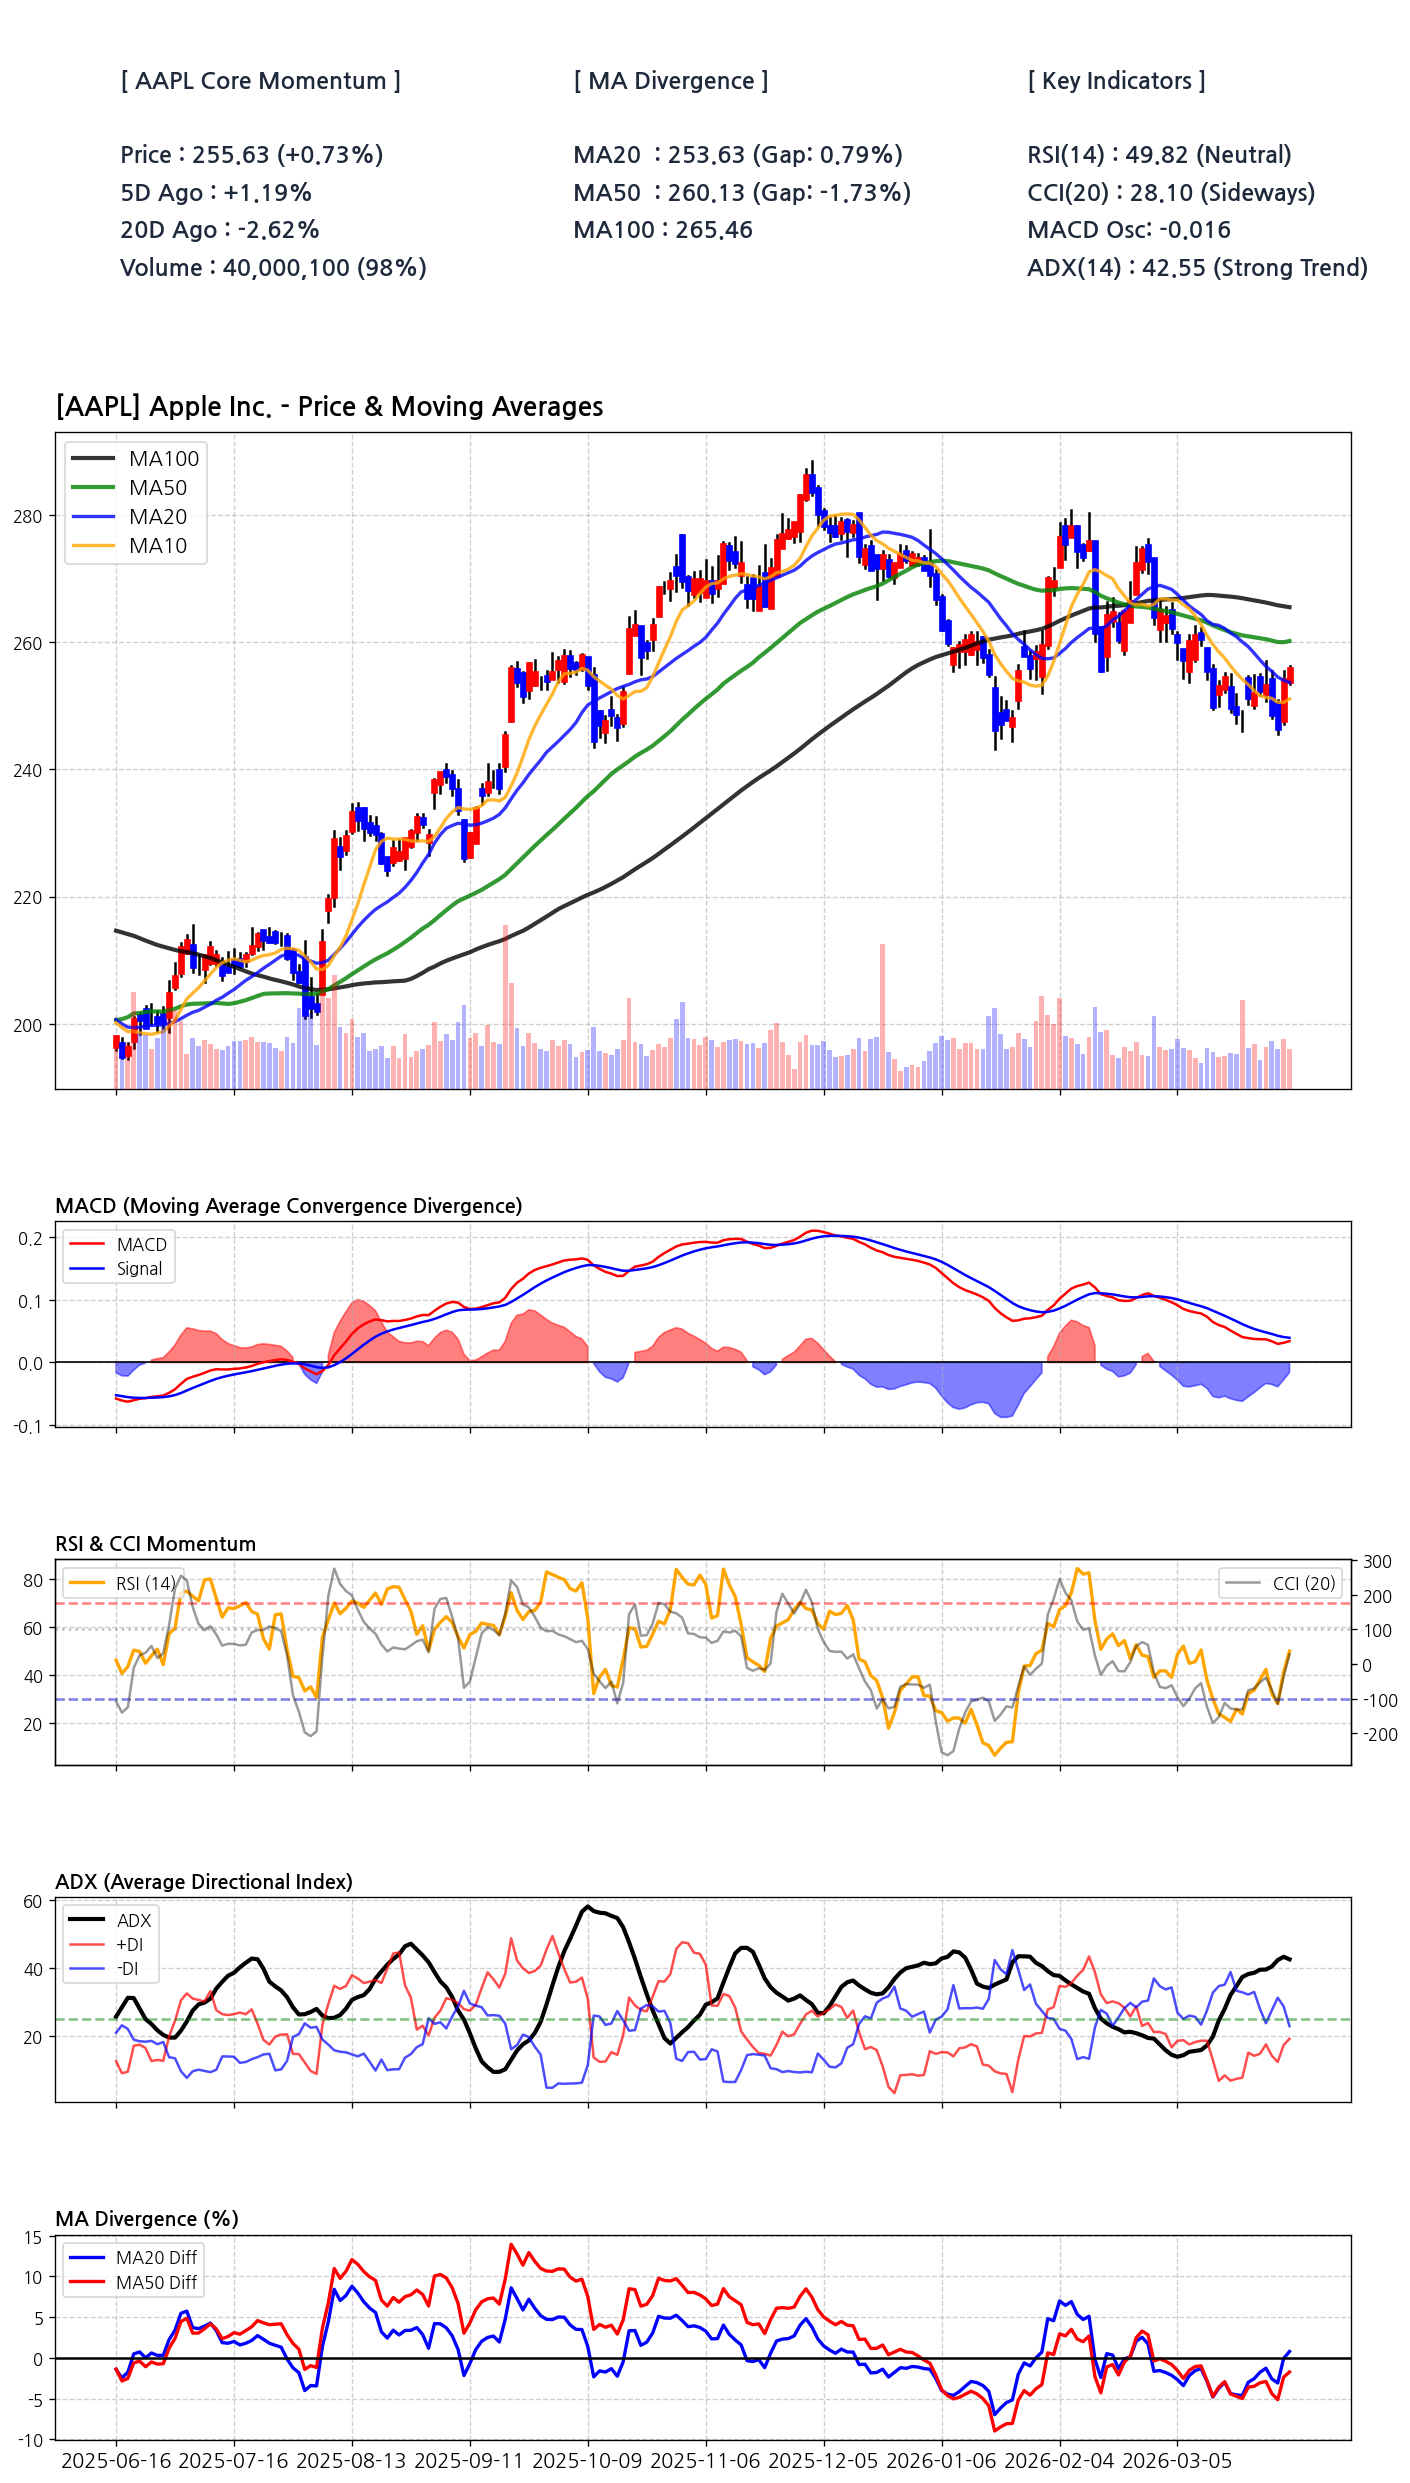
| Current Price | $255.63 | Neutral | Trapped between key moving averages. |
| ADX (14) | 42.55 | Strong Trend | Trend strength is high, but direction is ambiguous. |
| RSI (14) | 49.82 | Neutral | No immediate overbought or oversold pressure. |
| MACD Osc | -0.016 | Slightly Bearish | Momentum is negative but weak, suggesting consolidation. |
| MA50 Gap | -1.73% | Bearish | Price is trading below the key 50-day average. |
The Trend's Identity Crisis: High ADX Meets Directional Ambiguity
The current technical landscape presents a classic paradox. An Average Directional Index (ADX) of 42.55 signals a powerful, established trend. However, this is a lagging indicator reflecting the recent downward move. Contrasting this are the forward-looking momentum oscillators: the RSI hovers at a neutral 49.82 and the MACD Oscillator is nearly flat at -0.016. This divergence suggests the market is pausing, with the underlying trend strength yet to commit to a new direction. This is not a time for conviction, but for vigilance, as the market is coiling for its next significant move. The high ADX confirms that when the break comes, it is likely to be sharp and sustained.
Moving Average Compression Signals a Volatility Breakout
- MA10 & MA20 Crossover: The short-term moving averages are tightly coiled around the current price, indicating a lack of immediate directional momentum and an equilibrium between buyers and sellers.
- Price vs. MA50/MA100: The price is currently pinned below the MA50 ($260.13) and MA100 ($265.46), which are acting as formidable overhead resistance levels. A failure to reclaim these levels could invite further selling pressure.
- The Squeeze: This convergence of multiple moving averages within a tight price range is a textbook example of a significant volatility compression. Such periods are almost invariably followed by a volatility expansion, meaning a sharp price move is becoming statistically more probable.
Probabilistic Future State Scenarios for AAPL
| Scenario | Probability | Price Target | Key Drivers & Triggers |
|---|---|---|---|
| Base Case (Sideways) | 60% | $248 - $268 | Continued market indecision; price respects MA50 resistance and recent support; awaits next earnings catalyst. |
| Bull Case (Breakout) | 25% | $295 | A decisive close above $270; positive earnings surprise; broader market rally; strong services growth narrative. |
| Bear Case (Correction) | 15% | $225 | A sustained break below $248 support; macroeconomic headwinds; negative regulatory news; institutional profit-taking. |
The Institutional Bedrock Remains Unshaken
Wall Street's consensus remains firmly bullish with a target price of $295.07, implying a 15.43% upside. This conviction is anchored by massive institutional ownership from players like Vanguard and Blackrock, who collectively hold over 2.5 billion shares. This institutional safety net provides a strong underlying bid for the stock, likely preventing catastrophic declines barring a black swan event and suggesting that dips towards major support levels will be aggressively bought.
Key Price Levels Defining the Battlefield
[Chart] Visualization of AAPL's critical support and resistance levels. The stock is currently trading in a narrow channel, with a breakout above $265 or a breakdown below $248 expected to trigger the next major trend.
Earnings Momentum Provides a Fundamental Tailwind
- Consistent Beats: The company has a strong history of exceeding analyst expectations, with the last four quarters showing positive earnings surprises ranging from 1.69% to 10.12%.
- Forward Guidance: This track record of outperformance builds credibility and often leads to upward revisions in future estimates, creating a positive feedback loop for the stock price.
- Next Catalyst Date: The upcoming earnings report will be the primary catalyst to break the current deadlock. Another significant beat could easily provide the fuel to challenge the $288 all-time high.
Valuation's Tightrope Walk Demands Perfection
While the operational performance is stellar, the valuation is demanding. A trailing P/E of 32.36 and a Price-to-Book ratio of 42.62 indicate that significant future growth is already priced in. This valuation premium leaves little room for error. Any sign of slowing revenue growth or margin compression could trigger a rapid de-rating of the stock, as investors would no longer be willing to pay such a high multiple. The current consolidation reflects this tension between outstanding fundamentals and a rich valuation.
Core Financial Health Remains a Fortress
| Metric | Value | Implication |
|---|---|---|
| Free Cash Flow (FCF) | $106.3B | Extremely Strong |
| Return on Equity (ROE) | 152.02% | Best-in-Class |
| Current Ratio | 0.97 | Adequate Liquidity |
| Operating Margin | 35.37% | Highly Profitable |