A New Chapter or the Same Old Story?
AT&T's strategic retreat from the media landscape marks a critical inflection point. The company is betting its future on the stability of its core telecom business, a move designed to simplify operations and generate predictable cash flow. This refocus is a direct appeal to investors weary of empire-building and seeking reliable returns in a volatile market.
The Dividend as a Golden Handcuff
The company's dividend yield remains its most potent weapon in attracting capital. Management is walking a tightrope, balancing these shareholder payouts with the urgent need to deleverage a balance sheet still recovering from expensive acquisitions. The sustainability of this payout is the central question for any prospective investor.
| Metric | AT&T (T) | Verizon (VZ) | T-Mobile (TMUS) |
|---|---|---|---|
| Dividend Yield | ~ 6.5% | ~ 6.7% | ~ 0.5% |
| Payout Ratio | ~ 55% | ~ 50% | ~ 10% |
| Buyback Policy | Paused | Minimal | Active |
DIFF Insight: While AT&T's yield is competitive with Verizon's, its higher payout ratio and paused buybacks signal a tighter capital allocation strategy focused on debt reduction. T-Mobile's aggressive buybacks, funded by its lower dividend commitment, represent a contrasting growth-oriented approach that prioritizes share price appreciation over immediate income.
The Path to Profitability Regained
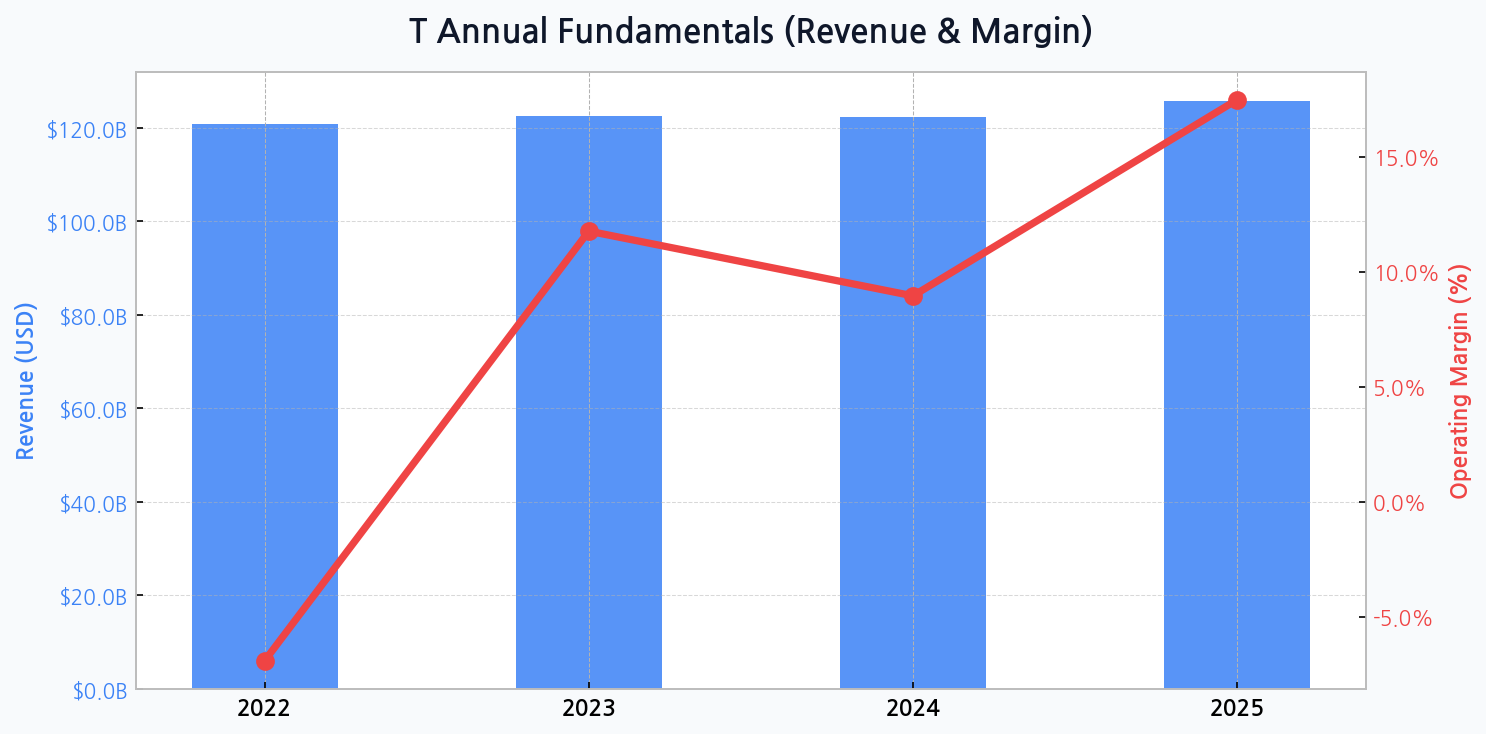
Financial projections paint a picture of gradual recovery. After a painful margin of -6.9% in 2022 on revenue of $120.7B, the company rebounded to 11.8% in 2023. While 2024 revenue is expected to be flat at $122.3B with a lower margin of 8.9%, the true test comes in 2025, where revenue is forecast to climb to $125.6B with a much healthier operating margin of 17.5%. This anticipated margin expansion is the linchpin of the bull thesis, predicated on shedding low-margin assets and realizing efficiencies.
[Chart] Total Assets (Bar) & Debt Ratio (Line) for T
[Chart] A visualization of AT&T's annual revenue and operating margin from 2022 to 2025, illustrating the expected margin recovery post-spinoff.
Wall Street's Cautious Optimism
The market has shifted from questioning AT&T's survival to scrutinizing its execution. The strategy is clear: focus, deleverage, and reward shareholders. Now, it's a 'show-me' story. Every basis point of margin improvement and every billion in debt paid down will be heavily rewarded.
Is the Stock a Value Play or a Value Trap?
Despite its massive scale, AT&T often trades at a discount to its peers. This reflects market skepticism about its growth prospects and the lingering burden of its debt. A valuation comparison reveals the stark contrast in how investors perceive the future of the major U.S. telecom players.
| Metric | AT&T (T) | Verizon (VZ) | Industry Average |
|---|---|---|---|
| Forward P/E | ~ 8.5x | ~ 8.2x | ~ 15x |
| EV/EBITDA | ~ 6.8x | ~ 7.0x | ~ 7.5x |
| Price/Book (PBR) | 1.80x | 1.75x | 2.2x |
DIFF Insight: AT&T and Verizon trade at similar, depressed multiples compared to the broader industry, highlighting a sector-wide concern over capital intensity and competition. The slight premium in T's PBR could reflect its extensive fiber and infrastructure assets, but the low earnings multiples underscore the market's demand for proof of sustainable growth and deleveraging before a re-rating occurs.
The Mountain of Debt
Financial health remains a primary concern. With total assets hovering around $400 billion, the company's debt ratio is a key metric. It has shown modest improvement, projected to decrease from 73.6% in 2022 to 69.4% by 2025. This gradual deleveraging is critical to reducing interest expense and freeing up cash flow, but the absolute debt level remains a significant headwind in a rising interest rate environment.
Navigating the Competitive Gauntlet
The telecom landscape is brutally competitive. AT&T faces intense pressure from both established rivals and disruptive cable operators entering the wireless market. This environment puts a ceiling on pricing power and necessitates continuous, massive capital expenditures.
| Risk Factor | Probability | Impact | Mitigation Strategy |
|---|---|---|---|
| Intense Price Competition | High | High | Network differentiation, customer bundling |
| Regulatory Scrutiny | Medium | Medium | Proactive compliance, industry lobbying |
| Interest Rate Hikes | High | Medium | Aggressive debt paydown, refinancing |
| Technological Disruption | Low | High | Investment in 5G/Fiber, R&D |
DIFF Insight: While technological disruption is rated as a low probability risk in the short term, its potential impact is catastrophic. AT&T's heavy investment in its existing 5G and fiber infrastructure is a defensive moat, but the company must remain vigilant against unforeseen technological shifts that could render its current assets obsolete.
The Core Investment Thesis
- Income Generation: The high, covered dividend provides a substantial cash return for investors.
- Deleveraging Story: Successful debt reduction could lead to a significant re-rating of the stock.
- Pure-Play Focus: The streamlined business model reduces complexity and focuses on core competencies.
- Asset Value: The company owns a vast, valuable portfolio of spectrum and fiber assets.